How to Report SEO to the Board (Pipeline, Not Traffic)
 Sabari Rohith
Last updated on
Sabari Rohith
Last updated on

You’ve got maybe ten minutes on the board agenda, sandwiched between the revenue update and the burn review. The deck you’d happily walk your marketing team through, rankings, traffic, a domain rating, is the fastest way to lose that room.
A board doesn’t care that SEO is busy. They care whether it pays, and whether it’ll keep paying. Here’s how we report SEO upward so it reads as a revenue channel, not a cost line waiting to get trimmed.
TL;DR
- A board is a different audience than your team: The standup deck answers “what did we do?”; the board only funds the answer to “what did it return, and is it compounding?”
- Open with the business outcome, not the activity: Lead with organic-sourced pipeline and where it sits against plan, then earn the right to show anything else.
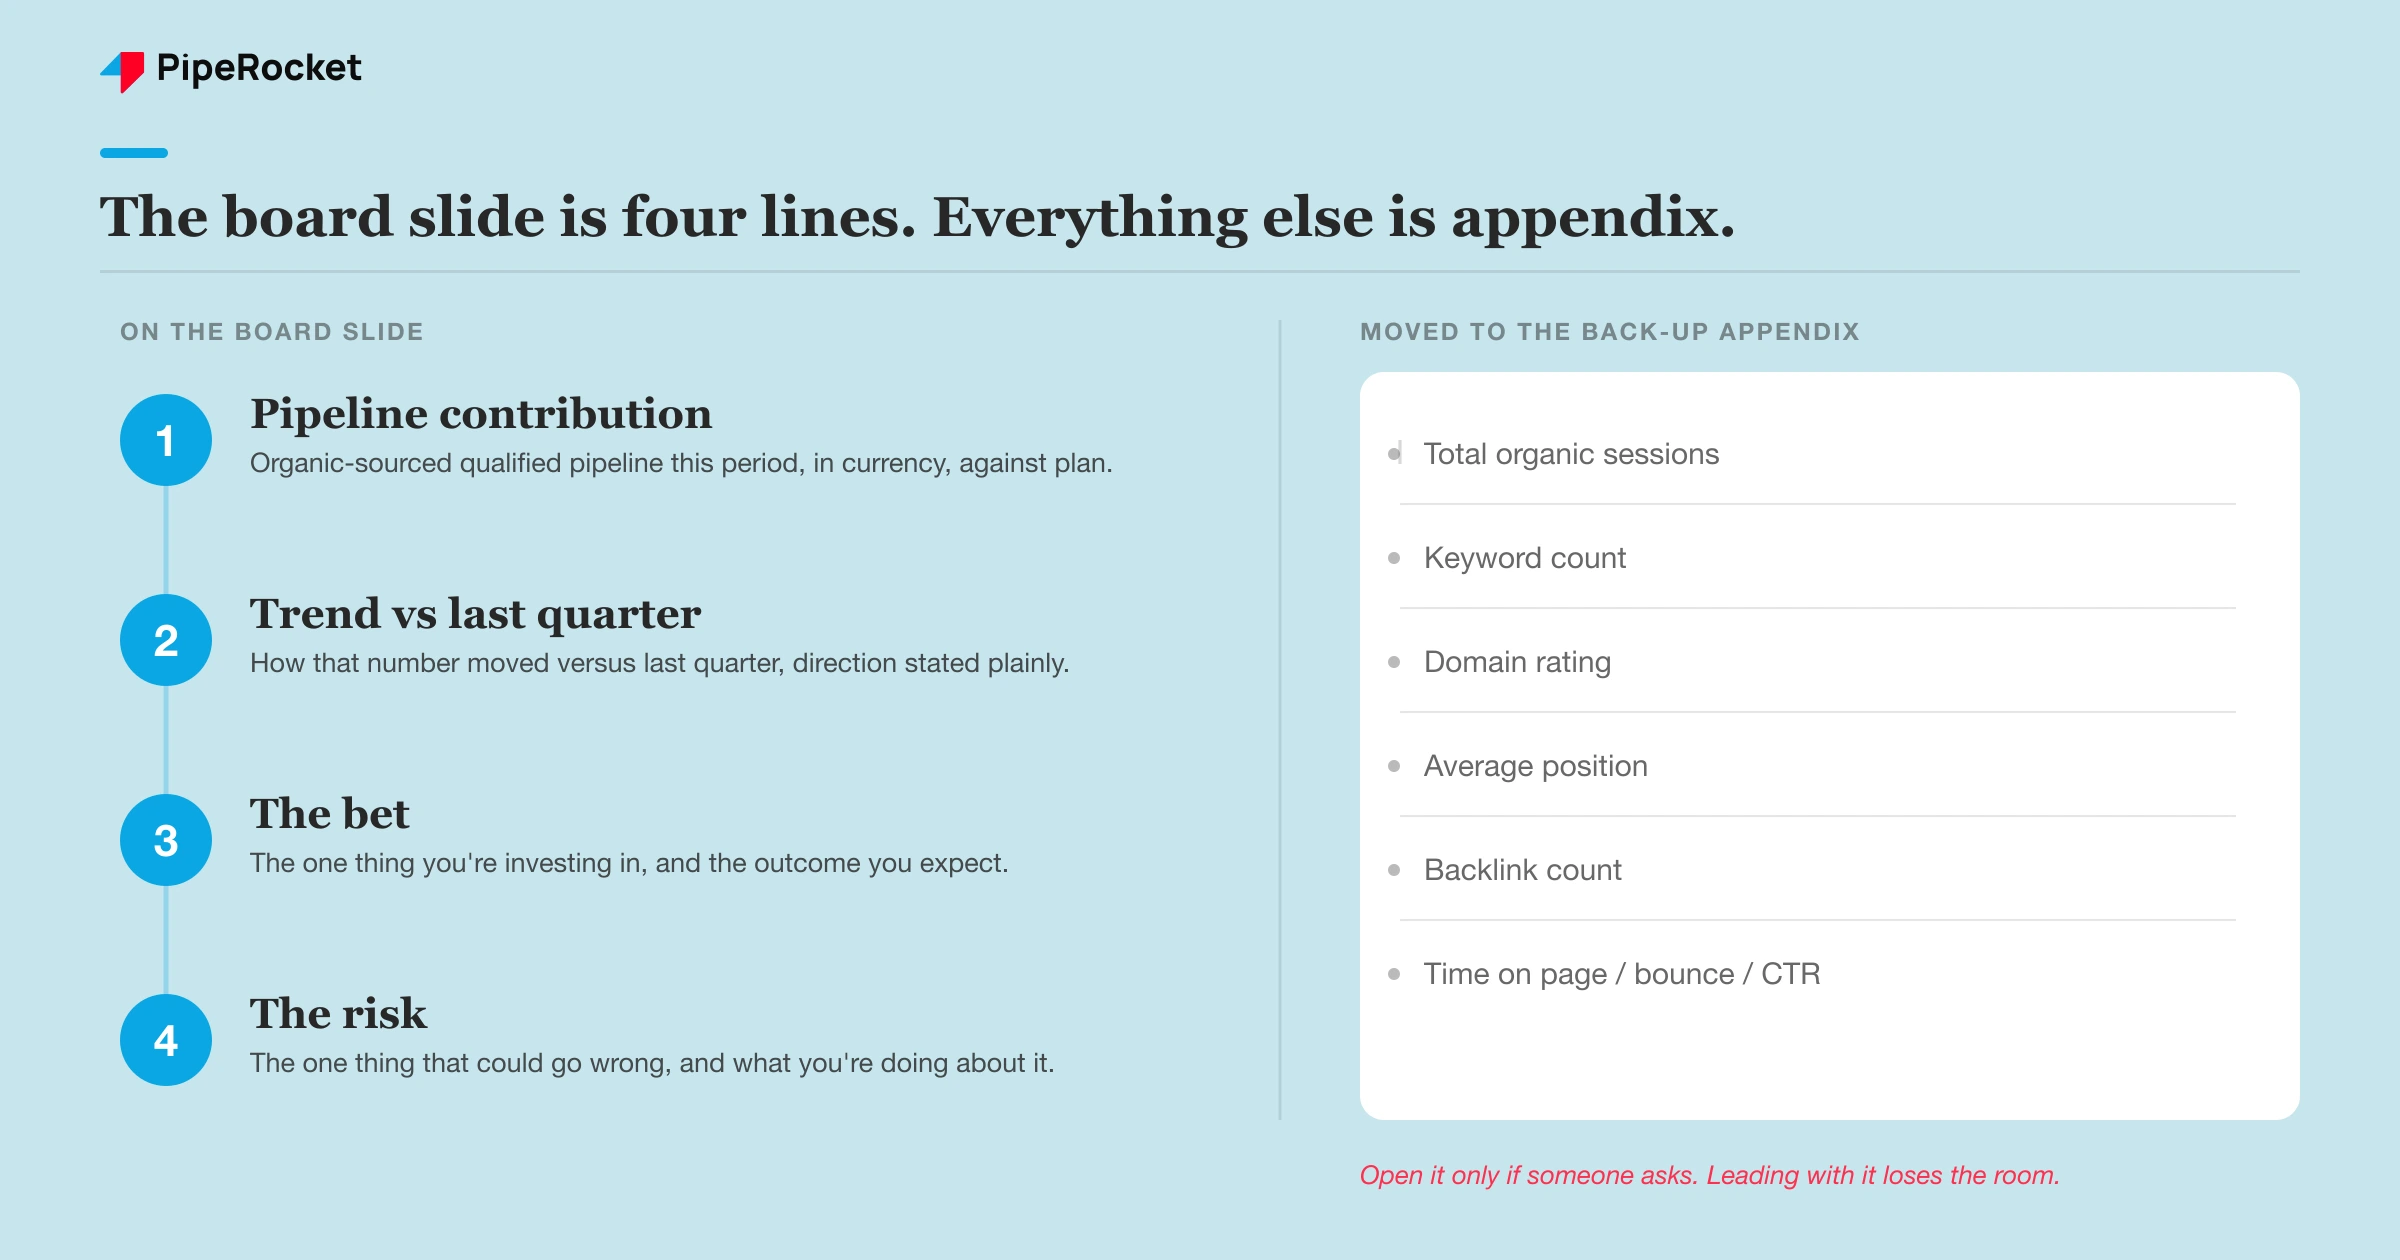
- One slide, four lines: Pipeline contribution, trend vs last quarter, the one bet you’re making, the one risk you’re watching. Everything else is backup.
- Cut the vanity metrics ruthlessly: Keyword counts, domain rating, and raw sessions belong in your working dashboard, never on the board slide.
- Report quarterly and own the bad quarter: A consistent quarterly story you narrate honestly builds more trust than a monthly chart that swings.
Why Your SEO Report Keeps Losing the Room
The report isn’t failing because SEO is failing. It’s failing because you’re presenting a marketing-team artifact to a finance-minded audience, and the two want completely different things.
Your two audiences want opposite things:
- Your team’s standup deck answers “what did we ship and what moved?” That’s the right conversation for a Monday.
- A board meeting asks whether the channel is returning money, whether the return is growing, and whether to put more behind it.
Walk in with the first deck and the room quietly files SEO under “cost we don’t fully understand.”
We’ve interviewed plenty of strong SEO managers over the years, and the pattern is the same. They can grow traffic, publish on cadence, fix the technical issues, then someone asks “what business impact did that create?” and the room goes quiet. The skill the board is testing isn’t execution. It’s translation.
So the reframe that fixes most board reports is simple. You’re not reporting on SEO. You’re reporting on a slice of pipeline that happens to come from organic search, told in the language the rest of the room already uses for revenue.
Step 1: Open With the Outcome, Not the Activity
Lead with the number that maps to the board’s job: how much qualified pipeline organic search sourced this period, and where that sits against plan. That’s the first thing out of your mouth, before a single chart.
Most SEO presenters do the opposite. They build up, context, methodology, rankings, traffic, then arrive at impact in the last 30 seconds, usually after the room has stopped listening. A board reads top-down. Give them the headline first, then let the curious ones pull on the detail in Q&A.
A clean opening line sounds like this: “Organic sourced X in qualified pipeline this quarter, up from last, which is Y% of new-business pipeline.” Three facts, no jargon, and every word is in their vocabulary. If you can’t say that sentence yet, your tracking isn’t board-ready, and that’s the real problem to fix before the next meeting.
This is also where you separate what you can prove from what you believe. Across the work we’ve done, a chunk of organic’s real impact surfaces later as branded or direct traffic that standard attribution never credits back.
Report two layers and label each honestly:
- Floor: the directly-attributed pipeline you can prove.
- Directional: the influenced pipeline, flagged as such.
Boards reward that candor: a presenter who separates proven pipeline from believed-influence reads as credible, while one defending a single too-clean figure invites the questions that derail the room.
Step 2: Build the One Slide That Carries the Whole Story
If a board member only looks at your slide for fifteen seconds, four lines should tell them everything. Build for that, because that’s the reality.
We’ve sat in enough quarterly business reviews to know the deck that works isn’t the dense one. It’s the one a busy executive can absorb at a glance and then ask a sharp question about. So the board slide carries exactly four things:
- Pipeline contribution: organic-sourced qualified pipeline this period, in currency, against plan.
- Trend: how that number moved versus last quarter, with the direction stated plainly.
- The bet: the one thing you’re investing in this quarter and the outcome you expect from it.
- The risk: the one thing that could go wrong, and what you’re doing about it.
That’s the slide. Rankings, traffic, publishing volume, all the operational detail, lives in a backup appendix you only open if someone asks. Leading with backup detail is the single most common way SEO presenters lose the thread.
One nuance worth naming. The “bet” and “risk” lines are what turn a report into a conversation. A number alone invites “okay, noted.” A bet and a risk invite the board to actually engage, weigh in, and back you, which is the entire point of being in the room.
Step 3: Narrate It Like a QBR, Not a Status Update
A board report is a story with a shape, not a list of metrics read aloud. The arc that lands is the same one we use in client quarterly reviews: where we said we’d go, what actually happened, what we’re doing next.
The way we run a QBR internally is deliberately not a parade of pretty dashboards. Every review opens with what isn’t working, then moves through Goals (what we set out to do), Results (what came back), and Actions (what changes next quarter). Opening with the honest part first is counterintuitive, and it’s exactly what builds trust in the room.
Here’s the arc, said out loud, in order:
- Last quarter we committed to X. Anchor on the goal the board already approved.
- Here’s what came back. The pipeline outcome, against that goal, good or bad.
- Here’s what worked and what didn’t. Name the miss before they find it.
- So next quarter we’re doing Y. The forward bet, with the outcome you expect.
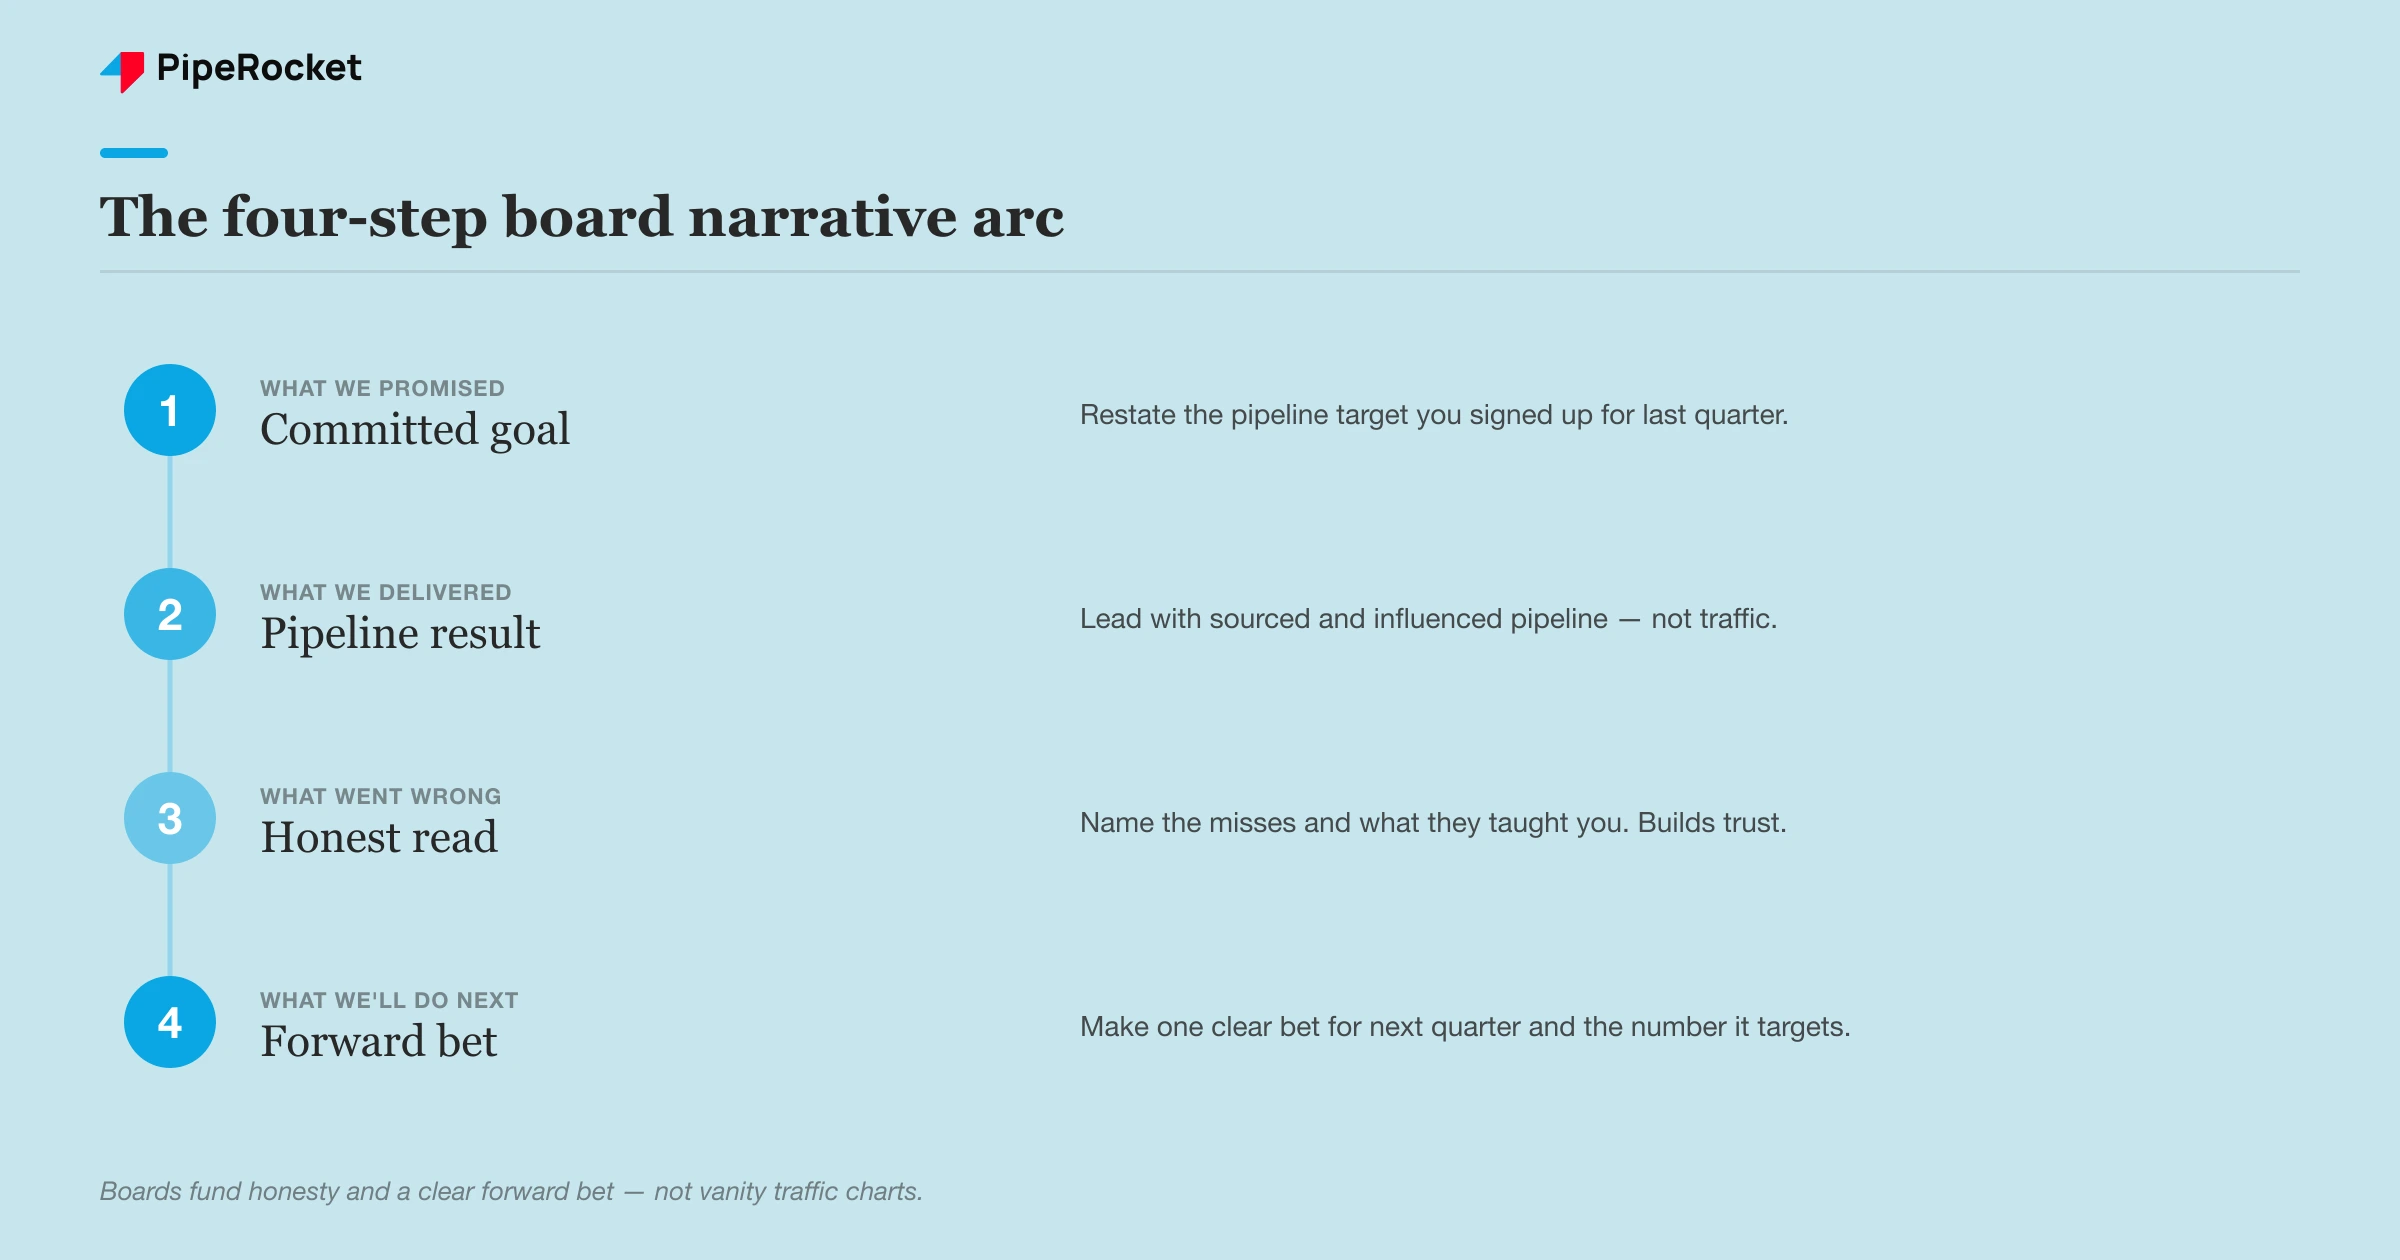
A compliance SaaS for fintech teams might open with “last quarter we bet that ranking the security-comparison pages would feed enterprise pipeline.” Then: here’s the pipeline those pages sourced, here’s where we fell short on the integrations content, here’s the fix. That’s a narrative a board can follow and fund. A table of keyword positions is not.
The forward bet matters more than people think. Boards fund direction, not history. If your report is all rear-view, you’re asking them to react; if it ends on a clear, outcome-tied bet, you’re asking them to invest, which is a far better conversation to be in.
Step 4: Cut the Vanity Metrics on Purpose
The fastest way to look junior in front of a board is to put a keyword count or a domain rating on the slide. Those numbers answer questions the board never asked, and every second spent on them is a second not spent on pipeline.
Our team has a phrase for the better instinct here: chase signals, not sessions. Rankings and traffic are activity, the early signals that the work is happening. The board cares about what those signals turned into. So most of what feels impressive in your tool sits in the appendix, and only the pipeline story makes the slide.
Here’s the honest split between what earns a place in front of the board and what doesn’t:
| Put it on the board slide | Cut it (keep in your appendix) |
|---|---|
| Organic-sourced qualified pipeline | Total organic sessions |
| Pipeline trend vs last quarter | Keyword count / “ranking for 4,000 terms” |
| Influenced pipeline (flagged as directional) | Domain rating / domain authority |
| The bet for next quarter | Average position across all keywords |
| The risk you’re managing | Backlink count |
| Organic’s share of new-business pipeline | Time on page, bounce rate, raw CTR |
Read that table before you build a single slide. The left column is a revenue conversation. The right column is an SEO conversation, and the board didn’t come for an SEO conversation.
This doesn’t mean the right-column metrics are useless. They’re how you and your team diagnose and steer the work week to week, and you should track them obsessively. The point is audience. A metric that’s load-bearing in your dashboard can be pure noise on a board slide, and knowing the difference is most of the skill.
Step 5: Pick a Cadence and Survive the Bad Quarter
Report SEO to the board quarterly, with a method that never changes, and narrate the down quarters as honestly as the up ones. Consistency of method is what earns trust, not the size of any single number.
A monthly report trains a board to react to noise, because SEO compounds and lags and a single month tells you almost nothing. A quarterly report, built the same way every time, trains them to treat organic like the investment it is. The reporting interval is itself a positioning choice: a monthly drumbeat frames SEO as an ops activity to monitor, while a quarterly review frames it as a channel the board allocates budget to.
Lock the method so the story stays comparable quarter to quarter:
- Same definition of “qualified pipeline” every time.
- Same attribution rules, even when they’re unflattering.
- Same slide shape, so the board reads it in seconds.
Then there’s the quarter where the number’s down. The instinct is to bury it under a good-looking chart. Resist it. We watch performance closely and flag a wrong direction early with a plan attached, and that proactive honesty is what makes a client, or a board, keep backing you.
Tip: Walk in with “pipeline dipped, here’s why, here’s the fix, here’s when it recovers” and you’ll keep the room’s trust through a bad quarter. Hide it, and you lose them on the next good one.
One more alignment move that saves a lot of grief. When one board member tracks pipeline and another fixates on cost per acquisition, get everyone aligned on a single headline KPI before the meeting, ideally pipeline. Reporting against one agreed number beats defending five.
How PipeRocket Helps You Report SEO That Gets Funded
We don’t hand clients a rankings dashboard and call it reporting. As a SaaS SEO agency , we tie organic to pipeline and build the board-ready story around it: the one-slide pipeline view, the QBR-style narrative, and an honest read on what’s working and what isn’t.
Every quarter we run the review the way a board should hear it, what we committed to, what came back, and the forward bet, so SEO reads as a revenue channel instead of a line item. If you want SEO reported in terms your board will actually fund, reach out to us and we’ll build it with you.
Frequently Asked Questions
What SEO metrics should I report to the board?
Report organic-sourced qualified pipeline first, its trend against last quarter and plan, and organic’s share of total new-business pipeline. Add one forward bet and one risk you’re managing, so the board has something to engage with rather than just acknowledge.
Keep rankings, traffic, keyword counts, and domain rating in a backup appendix you only open if asked. The rule of thumb: if a metric doesn’t connect to money or to a decision the board can make, it doesn’t belong on the slide.
How is reporting SEO to executives different from reporting to a marketing team?
Your marketing team needs the operational detail, rankings, publishing cadence, technical fixes, because they act on it directly. A board needs the business outcome and the forward direction, because their job is to fund and steer, not execute.
Presenting the team’s deck to the board is the most common mistake, and it makes SEO look like activity without a return. Translate everything into pipeline, trend, and the bet you’re making, and cut the rest.
How often should I report SEO performance to the board?
Quarterly is the right cadence for a board, because SEO compounds and lags, and a monthly view mostly shows noise that trains leadership to react to the wrong thing. A quarterly report built the same way every time lets the board see a real trend and treat organic as an investment with a return.
Keep your internal tracking monthly or even weekly so you can steer the work, but report upward on a quarter. The consistency of the method matters more than the size of any single quarter’s number.