100+ Google Ads Benchmarks for B2B SaaS (Updated October 2026)
 Praveen Ravi
Last updated on
Praveen Ravi
Last updated on
For B2B SaaS companies, Google Ads non-brand search averages a $13.75 cost-per-click (CPC), a 3.60% click-through rate (CTR), and a 3.94% conversion rate (CVR), working out to roughly $207 per lead. Brand search costs a fraction of that: $3.12 CPC and $34 per lead.
If you run paid acquisition for a B2B SaaS company, you have probably been handed “industry benchmarks” or PPC benchmarks scraped from a vendor survey or a blog that never says whose accounts it looked at. Those numbers are usually a black box.
So we opened ours. We pulled 24 months of real Google Ads performance, from July 2024 through June 2026, from 53+ B2B SaaS accounts we actively manage, converted every currency to USD, and lined up each account’s own numbers to find the average account, so one big spender cannot drag the benchmark. No survey. No estimates. Just what we see in the accounts.
Every benchmark below comes from that dataset. Where a cut is too thin to be statistically honest, we say so rather than dress it up.
Core Google Ads Benchmarks for B2B SaaS
- The average B2B SaaS Google Ads account’s core 2026 metrics:
- CTR: 3.60%
- CPC: $6.81
- Conversion rate: 2.57%
- Cost per lead (blended): $84
- Non-brand search leads cost far more than brand leads, driven almost entirely by a gap in click price rather than conversion rate:
- Non-brand cost per lead: $207
- Brand cost per lead: $34
- Non-brand CPC: $13.75
- Brand CPC: $3.12
- Brand search earns a dramatically higher click-through rate than non-brand search:
- Brand CTR: 22.2%
- Non-brand CTR: 3.6%
- B2B SaaS Google Ads got more efficient year over year, as conversion rates climbed while click costs held flat:
- Conversion rate: +48% YoY
- CPC: −1% YoY
- Cost per lead (blended): −36% YoY
- Non-brand search bucked that trend and got less efficient year over year, even as brand efficiency improved:
- Non-brand CTR: −30% YoY
- Non-brand cost per lead: +16% YoY
- Performance Max delivers cheaper B2B SaaS leads than Search, though PMax blends in softer conversions, so the gap reflects volume more than quality:
- Performance Max cost per lead: $25
- Search cost per lead: $143
- Technical SaaS (dev tools, security) leads cost far more than GTM and martech leads:
- Technical SaaS cost per lead: $855
- GTM & Martech cost per lead: $126
- India’s clicks cost roughly a fifth of the US’s, but its cost per lead is only modestly cheaper because its conversion rate runs lower:
- United States CPC: $9.26 · cost per lead: $92
- India CPC: $1.94 · cost per lead: $66
- United Kingdom CPC: $5.81 · cost per lead: $75
- Canada CPC: $8.89 · cost per lead: $168
- We exclude ROAS because B2B SaaS accounts optimize to lead conversions rather than tracked revenue value, which makes ROAS non-comparable across accounts.
How We Built These Benchmarks
Before the numbers, the method, because a benchmark you cannot interrogate is just a vibe.
- Source: 53+ B2B SaaS accounts PipeRocket actively manages.
- Window: trailing 12 months (July 2025 to June 2026), compared against the prior 12 months (July 2024 to June 2025).
- How we summarize: we work out each account’s own CTR, CPC, conversion rate , and cost per lead first, then report the average account (the middle of the pack). Adding all the raw numbers together would let the single largest spender set the “benchmark,” which is exactly the distortion most published benchmarks suffer from.
- Currency: accounts billed in INR, EUR, and TWD are converted to USD at trailing-12-month average rates. CTR and conversion rate are currency-independent; CPC and cost per lead are USD-normalized.
- Year-over-year: every year-over-year figure compares only the accounts active in both periods, and reports how the average account’s own number changed. This keeps clients joining or leaving from distorting the trend.
- Anonymized: no individual account is identifiable. Vertical and regional cuts are reported only where at least five accounts sit in the bucket.
- Regional cuts: an account counts toward a region only if at least 5% of its own spend actually ran there, using Google Ads’ geographic reporting by physical location.
- “Conversion” / “lead”: a tracked Google Ads conversion such as a form fill, demo request, trial signup, or call. Exact definitions vary slightly by account, so treat cost per lead as a strong directional benchmark rather than an accounting figure.
- Excluded metrics: ROAS and conversion value, because B2B SaaS accounts optimize to lead conversions rather than tracked revenue, making value-based ratios non-comparable across accounts.
- Refresh cadence: last updated October 2026. We refresh this study as the trailing-12-month window rolls forward.
Overall Google Ads Benchmarks for B2B SaaS (2026)
These are the average values across all 53+ accounts for the trailing 12 months, the single-number answer to “what’s normal for B2B SaaS?”
| Metric | Average (B2B SaaS) |
|---|---|
| Click-through rate (CTR ) | 3.60% |
| Average cost per click (CPC) | $6.81 |
| Conversion rate | 2.57% |
| Average cost per lead (blended) | $84 |
- The $84 average cost per lead hides a wide brand vs non-brand spread, covered next, so treat it as a starting reference point rather than a target.
- At 2.57%, this doubles as the core Google Ads conversion rate benchmark for B2B SaaS accounts in 2026.
Brand vs Non-Brand: The Single Biggest Cost Driver
If you take one thing from this study, take this. Brand and non-brand search are two different games, and blending them is how B2B SaaS teams mis-set expectations.
| Metric | Non-brand search | Brand search |
|---|---|---|
| CTR | 3.60% | 22.21% |
| Avg CPC | $13.75 | $3.12 |
| Conversion rate | 3.94% | 3.73% |
| Cost per lead | $207 | $34 |
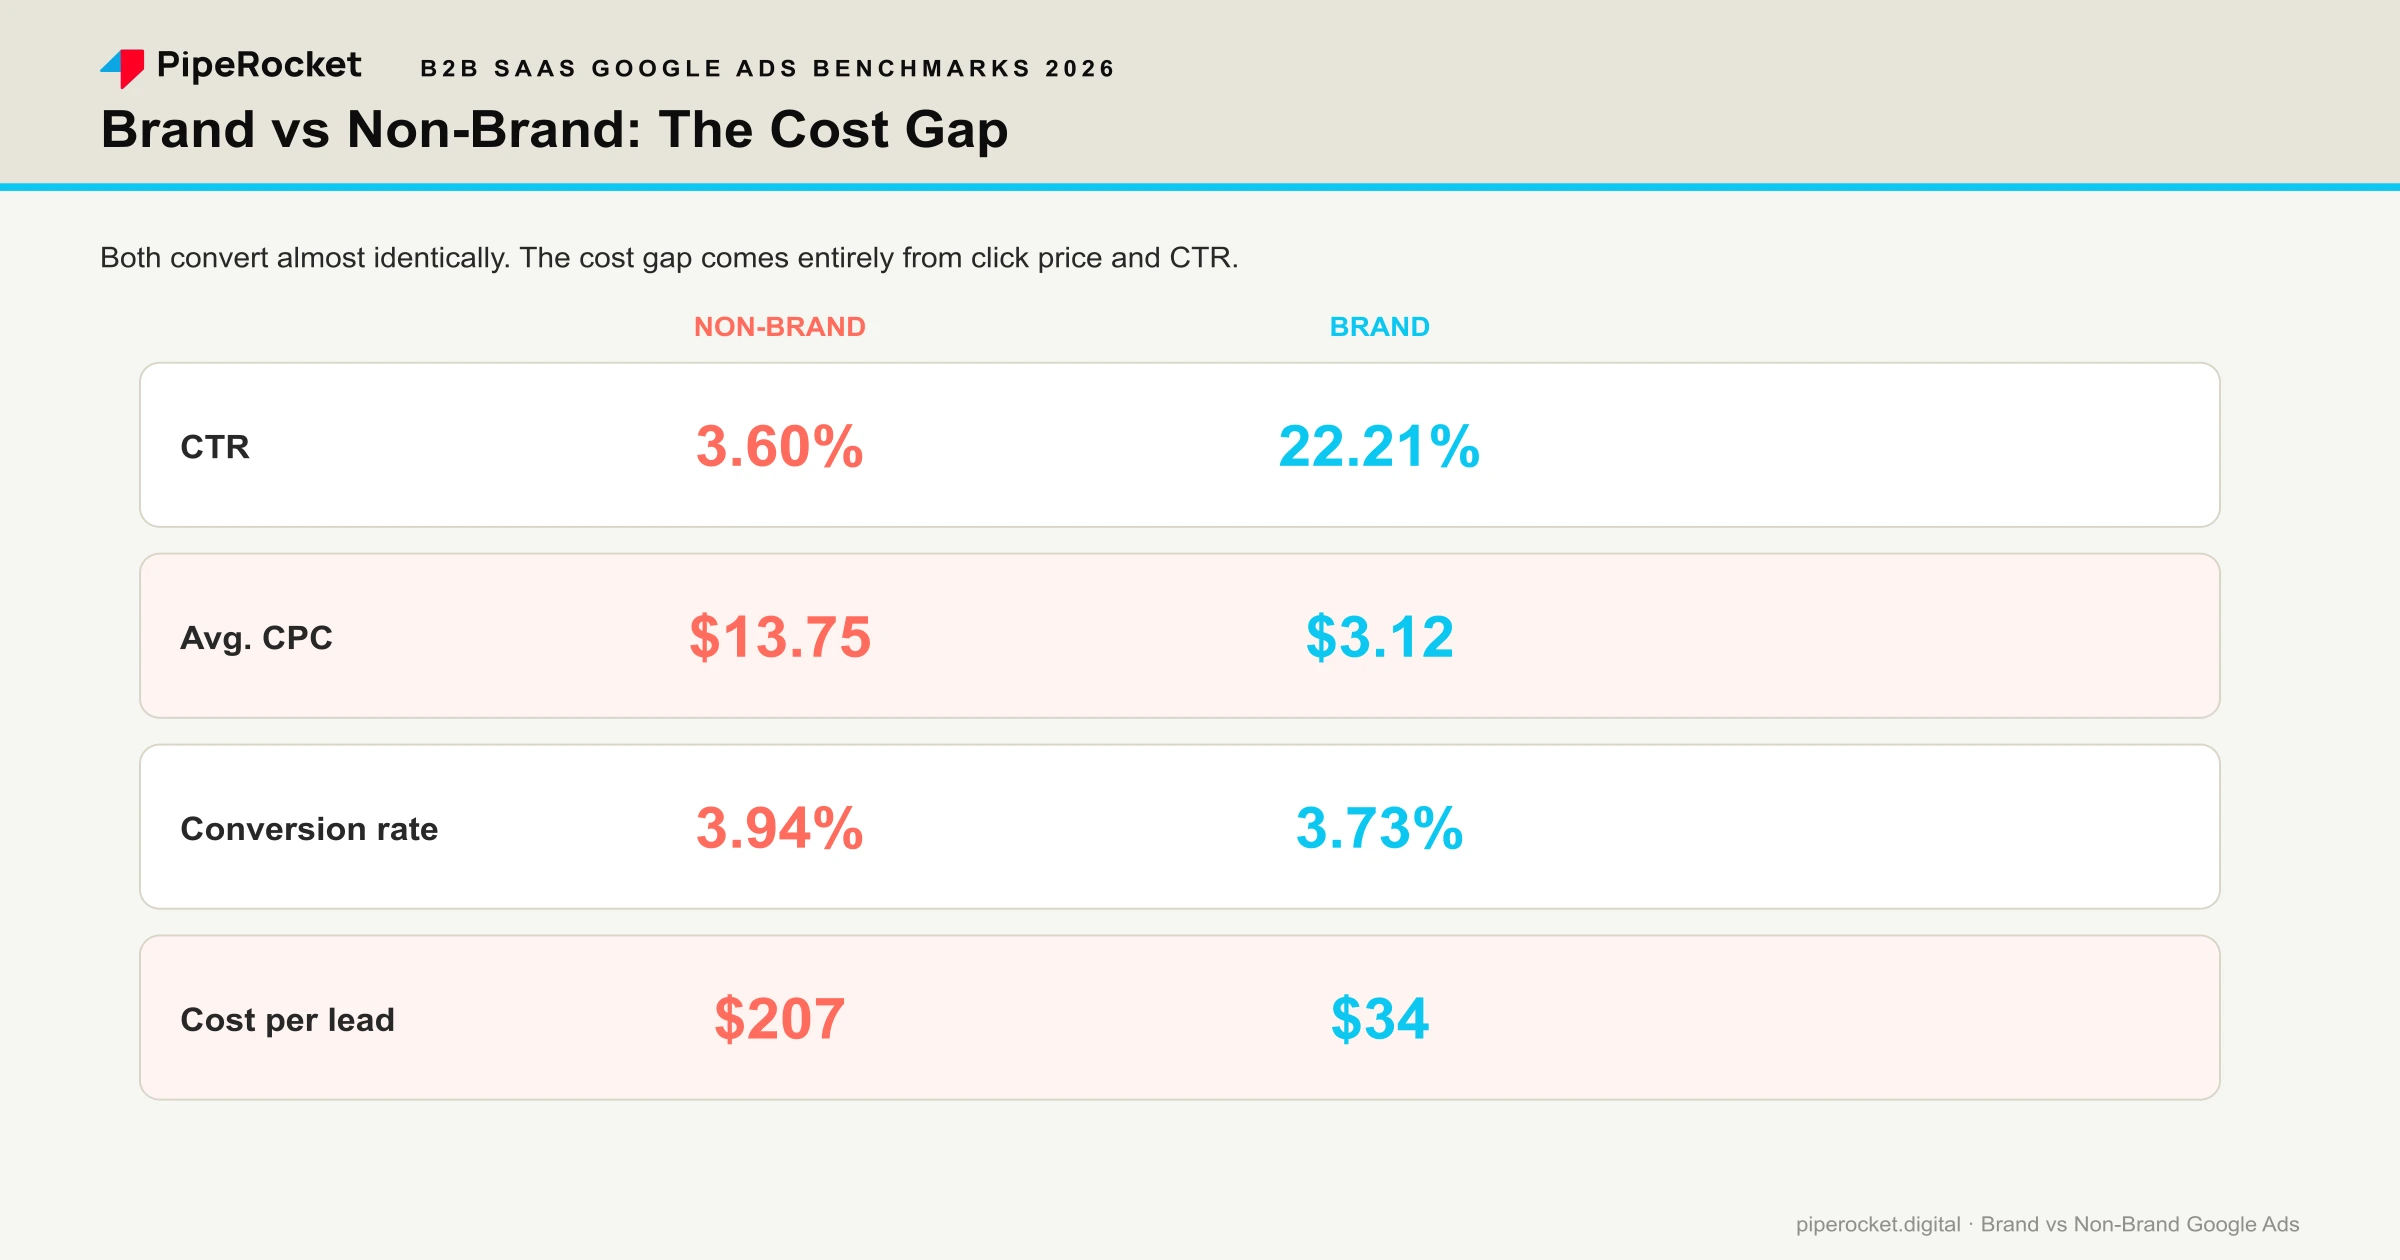
- The average B2B SaaS account pays $207 for a non-brand search lead, roughly 6x the $34 for a brand lead.
- B2B SaaS non-brand clicks cost an average $13.75, about 4.4x the $3.12 brand click. That click-price gap is the main driver of the lead-cost difference.
- B2B SaaS brand search CTR is 22.21%, roughly 6x the 3.60% non-brand CTR. Searcher intent, more than ad creative, drives the gap.
- Brand and non-brand convert nearly identically (3.73% vs 3.94%). The cost gap is an auction-price problem, so a landing-page fix will not close it.
- Budget and forecast brand and non-brand separately. A blended cost-per-lead target is meaningless, because a shift in brand-search volume alone can make the whole account look like it improved or collapsed.
Benchmarks by Campaign Type
Campaign type moves the numbers more than almost anything else. Here is the average figure for each over the trailing 12 months.
| Campaign type | CTR | Avg CPC | Conversion rate | Cost per lead |
|---|---|---|---|---|
| Search | 5.11% | $11.02 | 3.27% | $143 |
| Performance Max | 3.04% | $0.75 | 6.53% | $25 |
| Display | 1.07% | $0.68 | 0.30% | $219 |
| Demand Gen | 1.64% | $0.94 | 0.14% | $315 |
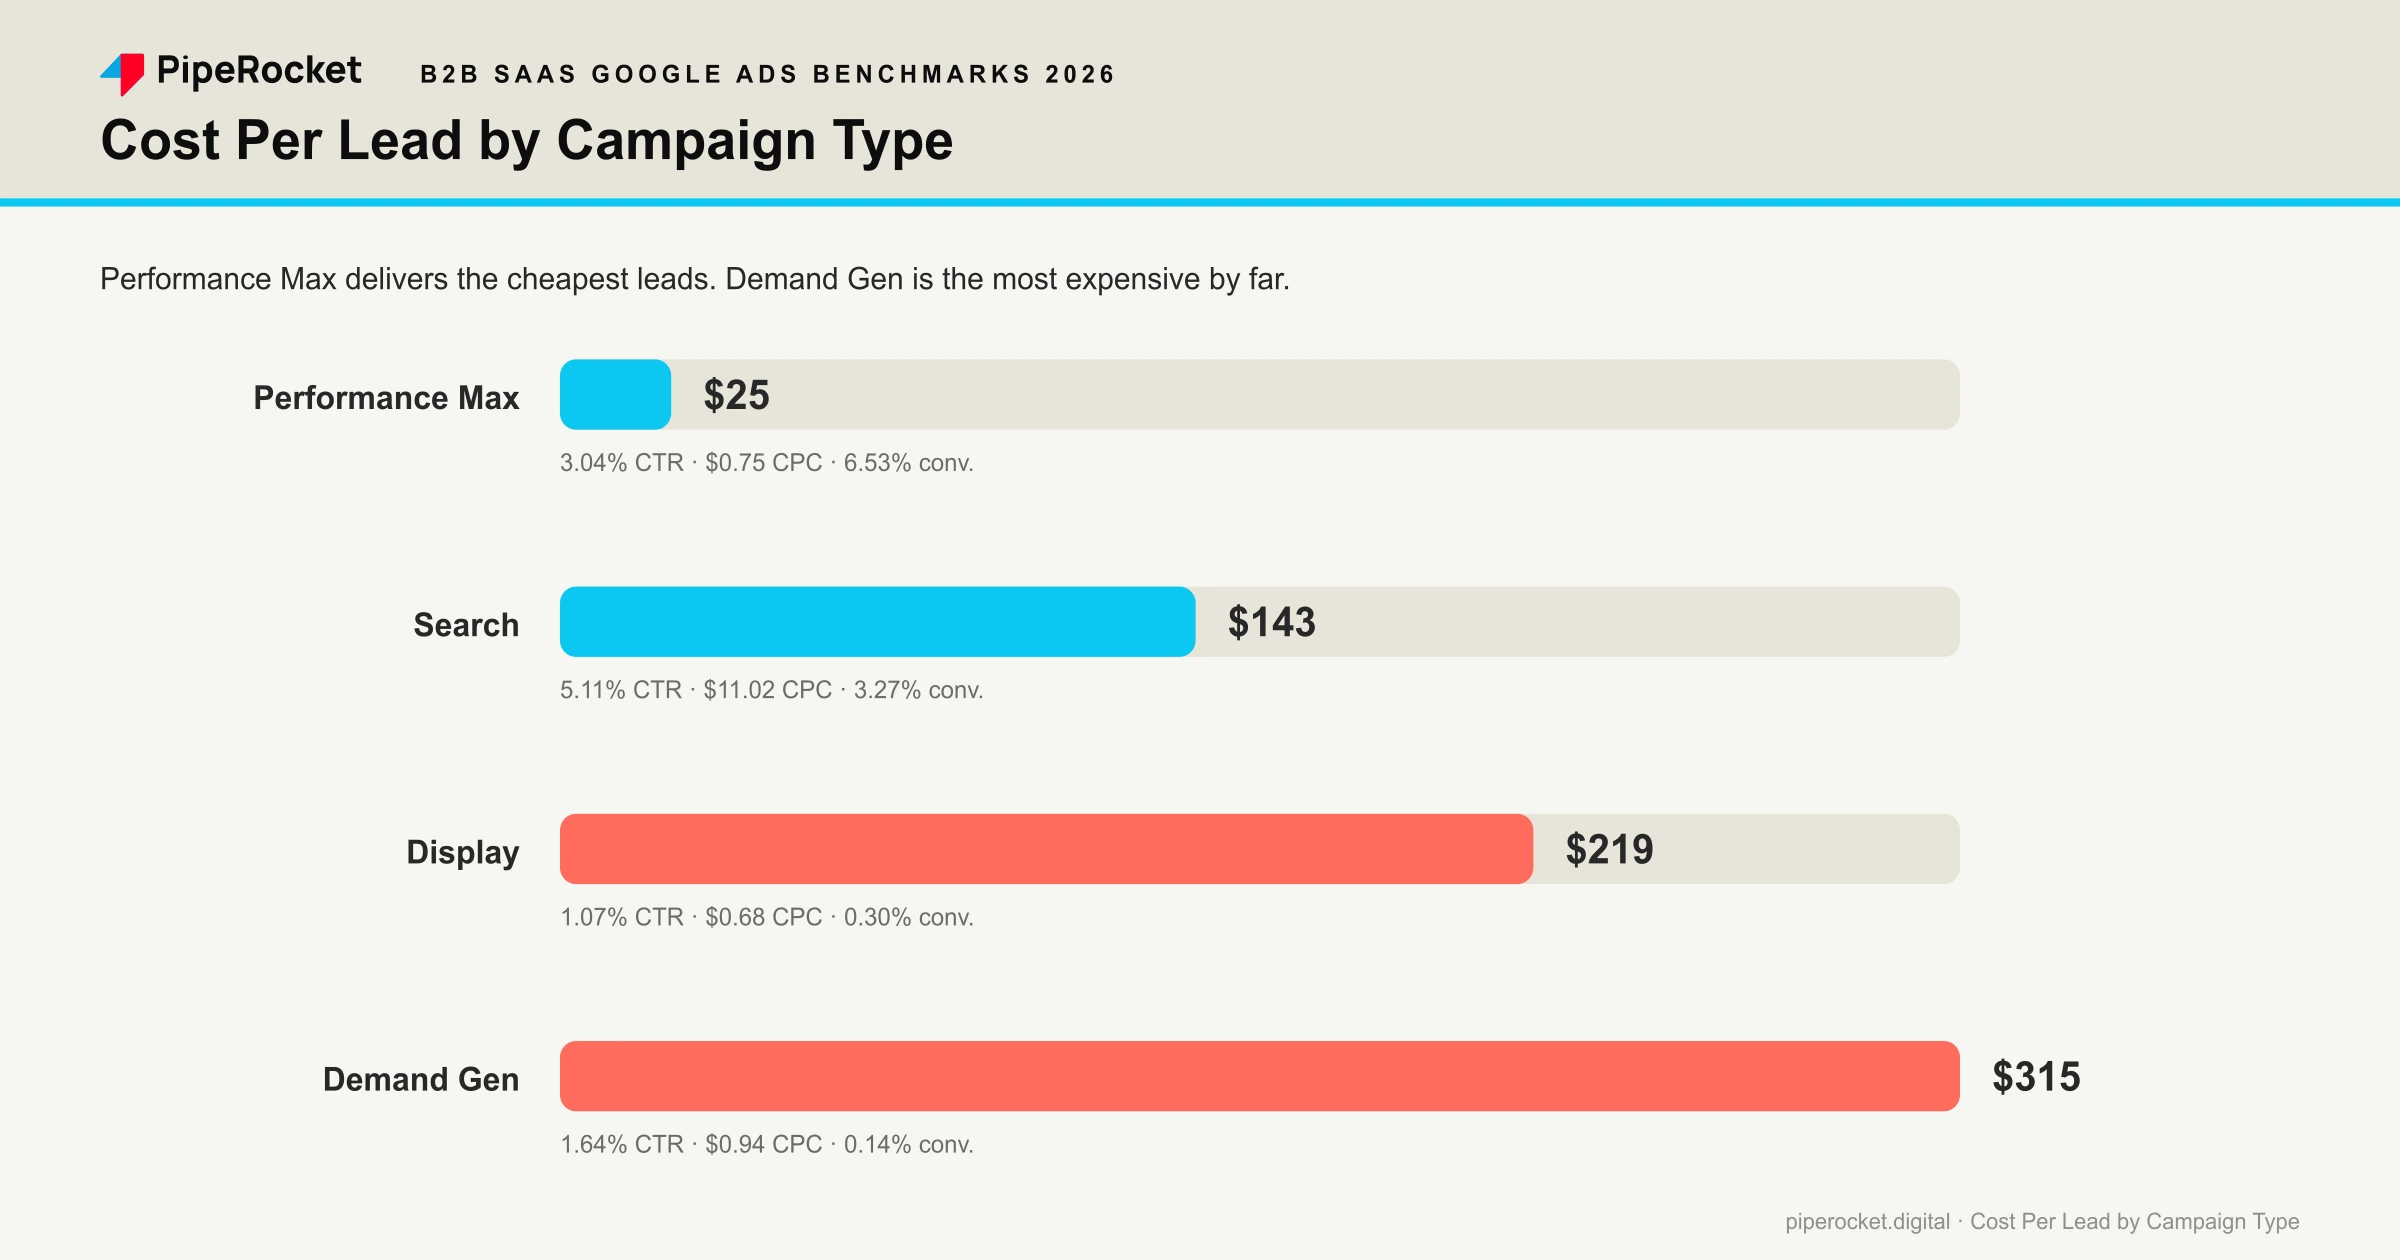
- B2B SaaS Search CPC is an average $11.02, about 15x the $0.75 Performance Max CPC.
- Performance Max has the lowest cost per lead ($25) and highest conversion rate (6.53%) of any B2B SaaS campaign type. PMax blends in branded and lower-intent placements, so treat those cheap conversions as volume rather than like-for-like Search leads.
- B2B SaaS Display and Demand Gen convert below 0.3%, at $219 and $315 per lead respectively. They work as upper-funnel prospecting, where a last-click CPL comparison undersells them.
- B2B SaaS Search delivers the strongest CTR at 5.11%, consistent with intent-matched keyword traffic outperforming interest-based placements.
Benchmarks by Sub-Vertical (Directional)
Here’s cost per lead by industry for the B2B SaaS verticals in our data. We can only report verticals where at least five accounts sit in the bucket, so this is two broad groups, and we treat it as directional rather than definitive.
| Sub-vertical | CTR | Avg CPC | Conversion rate | Cost per lead |
|---|---|---|---|---|
| GTM & Martech | 4.03% | $5.02 | 2.57% | $126 |
| Technical (dev tools, security) | 1.91% | $8.68 | 1.64% | $855 |
- Technical SaaS (dev tools, security) leads cost an average $855, about 6.8x the $126 for GTM and martech.
- Technical SaaS clicks cost ~1.7x more ($8.68 vs $5.02) and convert at roughly two-thirds the rate (1.64% vs 2.57%).
- GTM and martech ads earn a higher CTR (4.03% vs 1.91%) than technical SaaS, likely because their category terms map more cleanly to buyer language.
- Caveat: at five accounts per bucket, treat these as a directional signal about your likely starting point, not a precise target.
Benchmarks by Region
We only count an account as belonging to a region if at least 5% of its own spend actually ran there, then only report a region where at least five accounts clear that bar.
- The average B2B SaaS Google Ads account’s core 2026 metrics in the United States:
- CTR: 2.38%
- CPC: $9.26
- Conversion rate: 2.91%
- Cost per lead: $92
- The average B2B SaaS Google Ads account’s core 2026 metrics in India:
- CTR: 7.95%
- CPC: $1.94
- Conversion rate: 1.46%
- Cost per lead: $66
- The average B2B SaaS Google Ads account’s core 2026 metrics in the United Kingdom:
- CTR: 3.71%
- CPC: $5.81
- Conversion rate: 5.91%
- Cost per lead: $75
- The average B2B SaaS Google Ads account’s core 2026 metrics in Canada (directional, right at our reporting floor):
- CTR: 1.31%
- CPC: $8.89
- Conversion rate: 2.58%
- Cost per lead: $168
- India’s cost per click runs roughly a fifth of the US’s, but that advantage narrows sharply by the time it reaches cost per lead, because India’s conversion rate (1.46%) sits well below the US’s (2.91%).
- India still posts the lowest cost per lead of the four regions ($66 vs $92 for the US), just not by nearly as wide a margin as the CPC gap alone would suggest.
- Caveat: every other country in our data fell below the five-account floor, so we cannot responsibly report benchmarks outside these four regions.
Year-Over-Year Trends (Same Accounts, Both Years)
The three cuts above are all a snapshot of the last 12 months. This section is different: it tracks the same accounts across two full years, so roster changes cannot distort the trend.
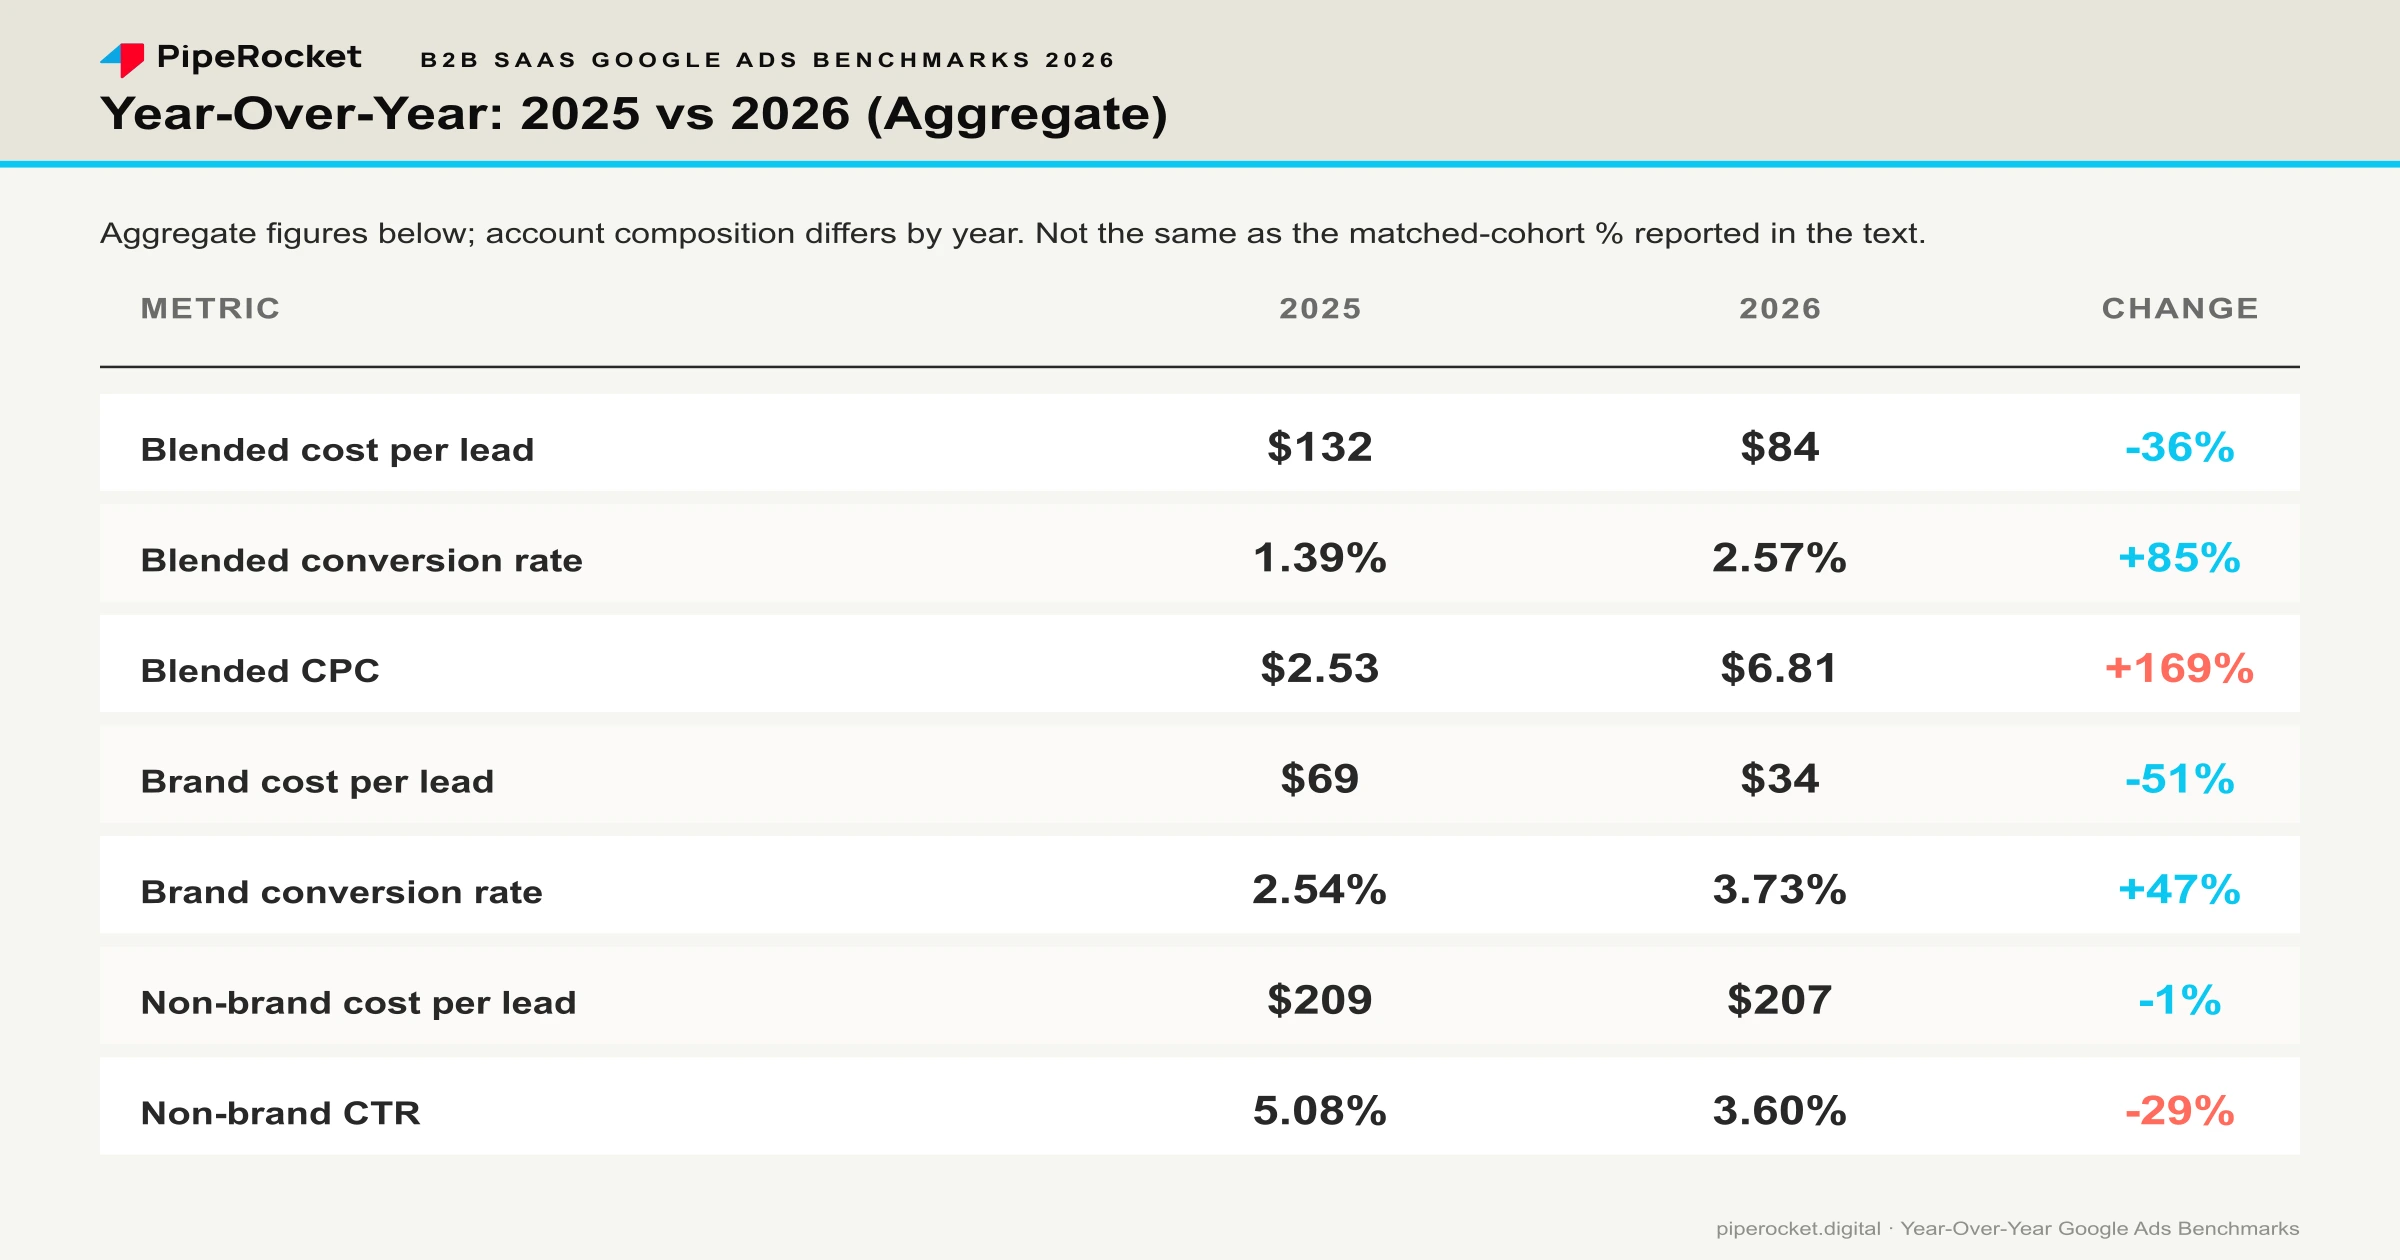
- B2B SaaS Google Ads conversion rates rose ~48% year over year, the standout efficiency gain in the dataset.
- The average B2B SaaS account’s CPC was flat year over year (−1%), despite widespread talk of AI inflating click prices.
- B2B SaaS blended cost per lead fell 36% year over year, from an average $132 to $84.
- B2B SaaS brand search improved most: brand conversion rate rose 39% and brand cost per lead fell 22% year over year.
- B2B SaaS non-brand search worsened: non-brand CTR fell 30% and non-brand cost per lead rose 16% year over year.
- B2B SaaS Google Ads got more efficient overall, but the gains came from brand and conversion-rate improvement rather than cheaper non-brand clicks.
2026 B2B PPC Statistics and Google Ads Industry Data
Everything above comes from our own client accounts. The Google Ads statistics and PPC benchmarks below are published third-party research, cited to their original source, added here for broader industry context rather than presented as our data.
Google Ads Performance Trends Across the Broader Market
From Optmyzr’s Q1 2026 benchmark report (more than 21,000 accounts tracked over five quarters, as covered by Search Engine Journal) and Tinuiti’s Q1 2026 Digital Ads Benchmark Report (based on advertising programs across Tinuiti’s more than $4 billion in annual ad spend under management):
- Google Ads click-through rate rose from 1.83% to 2.22% across the accounts Optmyzr tracked, a 21.31% year-over-year gain.
- Conversion rate declined 0.96% year over year across the same accounts, a much smaller move than the click-through-rate gain.
- Cost per acquisition rose 4.41% year over year, and impressions fell roughly 11% year over year, meaning the click and CTR gains came from a smaller, more targeted pool of impressions.
- Clicks on Google paid search ads grew 14% year over year in Q1 2026, per Tinuiti.
Ad Platform Revenue at Scale
From Alphabet’s , Microsoft’s , and Meta’s Q2 2026 earnings reports:
- Alphabet’s total Q2 2026 revenue reached $119.8 billion, up 24% year over year, with Google’s advertising revenue at $81.6 billion (up 14.5%), Google Search advertising at approximately $63.3 billion, and YouTube advertising at $11.06 billion (up 12.6%).
- Microsoft’s total fiscal Q2 2026 revenue reached $81.3 billion, up 17% year over year, with search and news advertising revenue (excluding traffic acquisition costs) up 10% year over year.
- Meta’s Q2 2026 advertising revenue reached $59.36 billion, up 27% year over year, with ad impressions up 14% and average price per ad up 12%.
The Digital Ad Market’s Growth and Search’s Shrinking Share of It
From the IAB’s 2026 Outlook Study (more than 200 brand and agency buyers surveyed), the IAB’s Internet Advertising Revenue Report , and eMarketer’s forecasts :
- US digital ad spend reached $294.6 billion in 2025, up 13.9% year over year, and the IAB forecasts 9.5% year-over-year growth in total US ad spend for 2026.
- US digital video ad spend is projected to surpass $80 billion in 2026, growing nearly 20% faster than the total ad market.
- Google’s share of US search ad spending will fall to 48.5% in 2026, the first time in more than 20 years that share has dropped below half.
- Global ad spending is projected to reach $1.170 trillion in 2026, with Google and YouTube combined projected to bring in $229.42 billion of it.
Search Behavior and the Rise of Zero-Click Results
From SparkToro’s 2026 zero-click search study (Similarweb clickstream data on US Google searches, first four months of 2026):
- 68.01% of US Google searches ended without a click in early 2026, up from 60.45% in 2024.
- Only 276 of every 1,000 US Google searches now reach the open web, down from 374 per 1,000 in the 2024 study.
B2B Marketing Budgets and Buyer Behavior
From Gartner’s 2026 CMO Spend Survey (401 CMOs and marketing leaders across North America, the UK, and Europe, surveyed January through March 2026), HubSpot’s 2026 State of Marketing report (1,500+ marketers globally), and Forrester’s B2B Sales Survey :
- The average marketing budget sits at 7.8% of company revenue in 2026, up slightly from 7.7% in 2025, with CMOs allocating an average of 15.3% of that budget to AI, though only 30% of CMOs report their organization mature enough to scale AI capabilities effectively.
- 79.2% of marketing teams expect at least a slight budget increase in 2026, 21.2% expect a significant increase, and only 6% forecast a decrease.
- 63% of sales leaders said digital buying behaviors would significantly impact their organization within two years, yet only 37% said digitizing the buyer’s journey was a top priority for their organization.
How LinkedIn Compares to Google and Meta for B2B Advertisers
From Dreamdata’s 2026 LinkedIn Ads Benchmarks Report (analysis of Dreamdata’s own B2B customer data, more than 66 million sessions and 3.5 million customer journeys):
- LinkedIn delivered 121% ROAS in 2025 for the B2B accounts Dreamdata tracked, up from 113% in 2024, against 67% ROAS for Google Search and 51% ROAS for Meta over the same accounts.
- LinkedIn now commands 41% of total B2B ad budgets in Dreamdata’s dataset, up 2 percentage points year over year.
What This Means for the Industry
Put our first-party numbers next to that external research and both a confirmation and a genuine divergence emerge.
- Our accounts are bucking the industry’s efficiency slide. Optmyzr’s wider pool saw conversion rate dip 0.96% year over year even as CTR jumped 21.31% (more traffic, converting worse). Our accounts moved the opposite way, conversion rate up ~48% on flat CPC, a sign well-optimized B2B SaaS accounts are capturing the AI-bidding upside the broader pool is missing.
- Demand for clicks is climbing everywhere. Tinuiti found Google paid search clicks up 14% year over year, and Alphabet’s ad revenue grew 14.5% year over year, confirming a more competitive market, which makes our accounts’ efficiency gain even more notable.
- Tight budgets make segment-level discipline more valuable. Marketing budgets crept from 7.7% to 7.8% of revenue, with 15.3% now earmarked for AI tooling most CMOs aren’t ready to use, raising the value of budgeting brand and non-brand apart and treating Performance Max efficiency skeptically.
- Most teams expect more budget heading into 2026. With 79.2% of marketing teams expecting an increase and only 6% expecting a cut, use the extra budget to compound the efficiency gains already underway rather than treating it as license to relax segment discipline.
- Paid search is fighting for a shrinking pool of clickable intent. Google’s share of US search ad spend is projected to fall below 50% for the first time in over 20 years, and 68% of US Google searches now end without a click, which raises the value of every click you do win.
- B2B sales teams are still underestimating how self-directed buyers have become. Only 37% of sales leaders rate digitizing the buyer journey a top priority, even though 63% believe digital buying behavior will significantly affect their business within two years, a gap a well-segmented Google Ads program can exploit before a competitor’s sales team even notices the buyer is in-market.
- Every major platform grew ad revenue at once, so Google is only half the channel-mix picture. Microsoft’s search ad revenue grew 10% year over year and Meta’s grew 27%, and Dreamdata puts LinkedIn’s B2B ROAS at 121% against Google Search’s 67% and Meta’s 51%, so weigh LinkedIn alongside everything above rather than treating Google as the only channel that matters.
What This Means for Your B2B SaaS Google Ads Budget
- Separate brand and non-brand in every forecast. A $34 brand lead and a $207 non-brand lead cannot share a target. If your CPL “improved,” check whether brand-search volume simply grew.
- Anchor non-brand expectations near $200 per lead, not $84. The blended number sets executives up for disappointment the moment you scale generic-term spend.
- Use Performance Max for efficiency and reach, but don’t let its $25 “CPL” set your quality bar. Audit what those conversions actually are before comparing them to Search.
- Don’t assume CPC inflation. For the average account it was flat year over year; your growth lever is conversion rate, where the average account gained ~48%.
- If you sell technical SaaS, budget for an ~$855 cost per lead from day one. That is the category norm, so plan spend and pipeline math around it.
The Bottom Line
The most useful benchmark is not a single “good” number, it is knowing which number applies to your situation. For B2B SaaS on Google Ads in 2026, that means budgeting brand and non-brand apart, expecting non-brand leads near $200, treating Performance Max efficiency skeptically, and chasing conversion-rate gains rather than assuming CPCs will fall.
If you want a second read on where your own account sits against these numbers, our Google Ads team runs a free audit, and we manage B2B SaaS PPC against exactly these numbers every day. Talk to us .