Most SaaS teams pick a PPC budget top-down. It’s a percentage of revenue, a number the CEO is comfortable with, or a figure a competitor mentioned on a podcast.
I build the forecast the other way. Start with the pipeline the business actually needs next quarter, then work backward through win rate, conversion rate, CPC, and land on the spend that gets you there. Done right, the budget defends itself before a dollar goes live.
TL;DR
- Start from the revenue goal. Work backward from target new ARR through deals, SQLs, MQLs, leads, and clicks to the spend that actually produces them.
- Gather five inputs before you model anything. CPC, landing-page CVR, lead-to-SQL and win rate, ACV, and sales-cycle length decide whether the math holds.
- Build the model as one table. Every stage is a row, every conversion rate is a lever, so anyone can see where the number came from and change one assumption at a time.
- Adjust for how SaaS actually works. A long sales cycle means this quarter’s spend shows up as next quarter’s revenue, so judge efficiency on LTV:CAC and payback over a trailing window.
- Stress-test, then reconcile against actuals. Run a pessimistic case before you commit, then compare forecast to real numbers every month and re-fit the assumptions.
Why Most SaaS PPC Budgets Are Guesses
Most SaaS PPC budgets are set top-down, and that’s the core problem. Someone decides to spend “10% of revenue” or “$40k a month because that’s what we did last year,” then hopes the leads show up. The number has no relationship to the pipeline the company needs.
Here’s what that gets you. You spend the budget, generate some leads, and three months later nobody can say whether it worked, because nobody wrote down what it was supposed to produce.
A forecast built backward from the revenue goal fixes that. Before launch, you know how many deals the spend should generate and what each one can cost. If the math says a qualified lead costs more than the deal is worth, you find that out on a spreadsheet instead of after burning a quarter’s budget.
Top-down also fails in SaaS because the money and the revenue don’t land in the same month. Spend today, close in 90 days. A model that ignores that lag looks broken in month one and gets killed before it had a chance to work.
Step 1: Work Backward From the Revenue Goal
Start at the revenue number and divide your way down to clicks. This is the spine of the whole forecast, so get it on paper before you touch anything else.
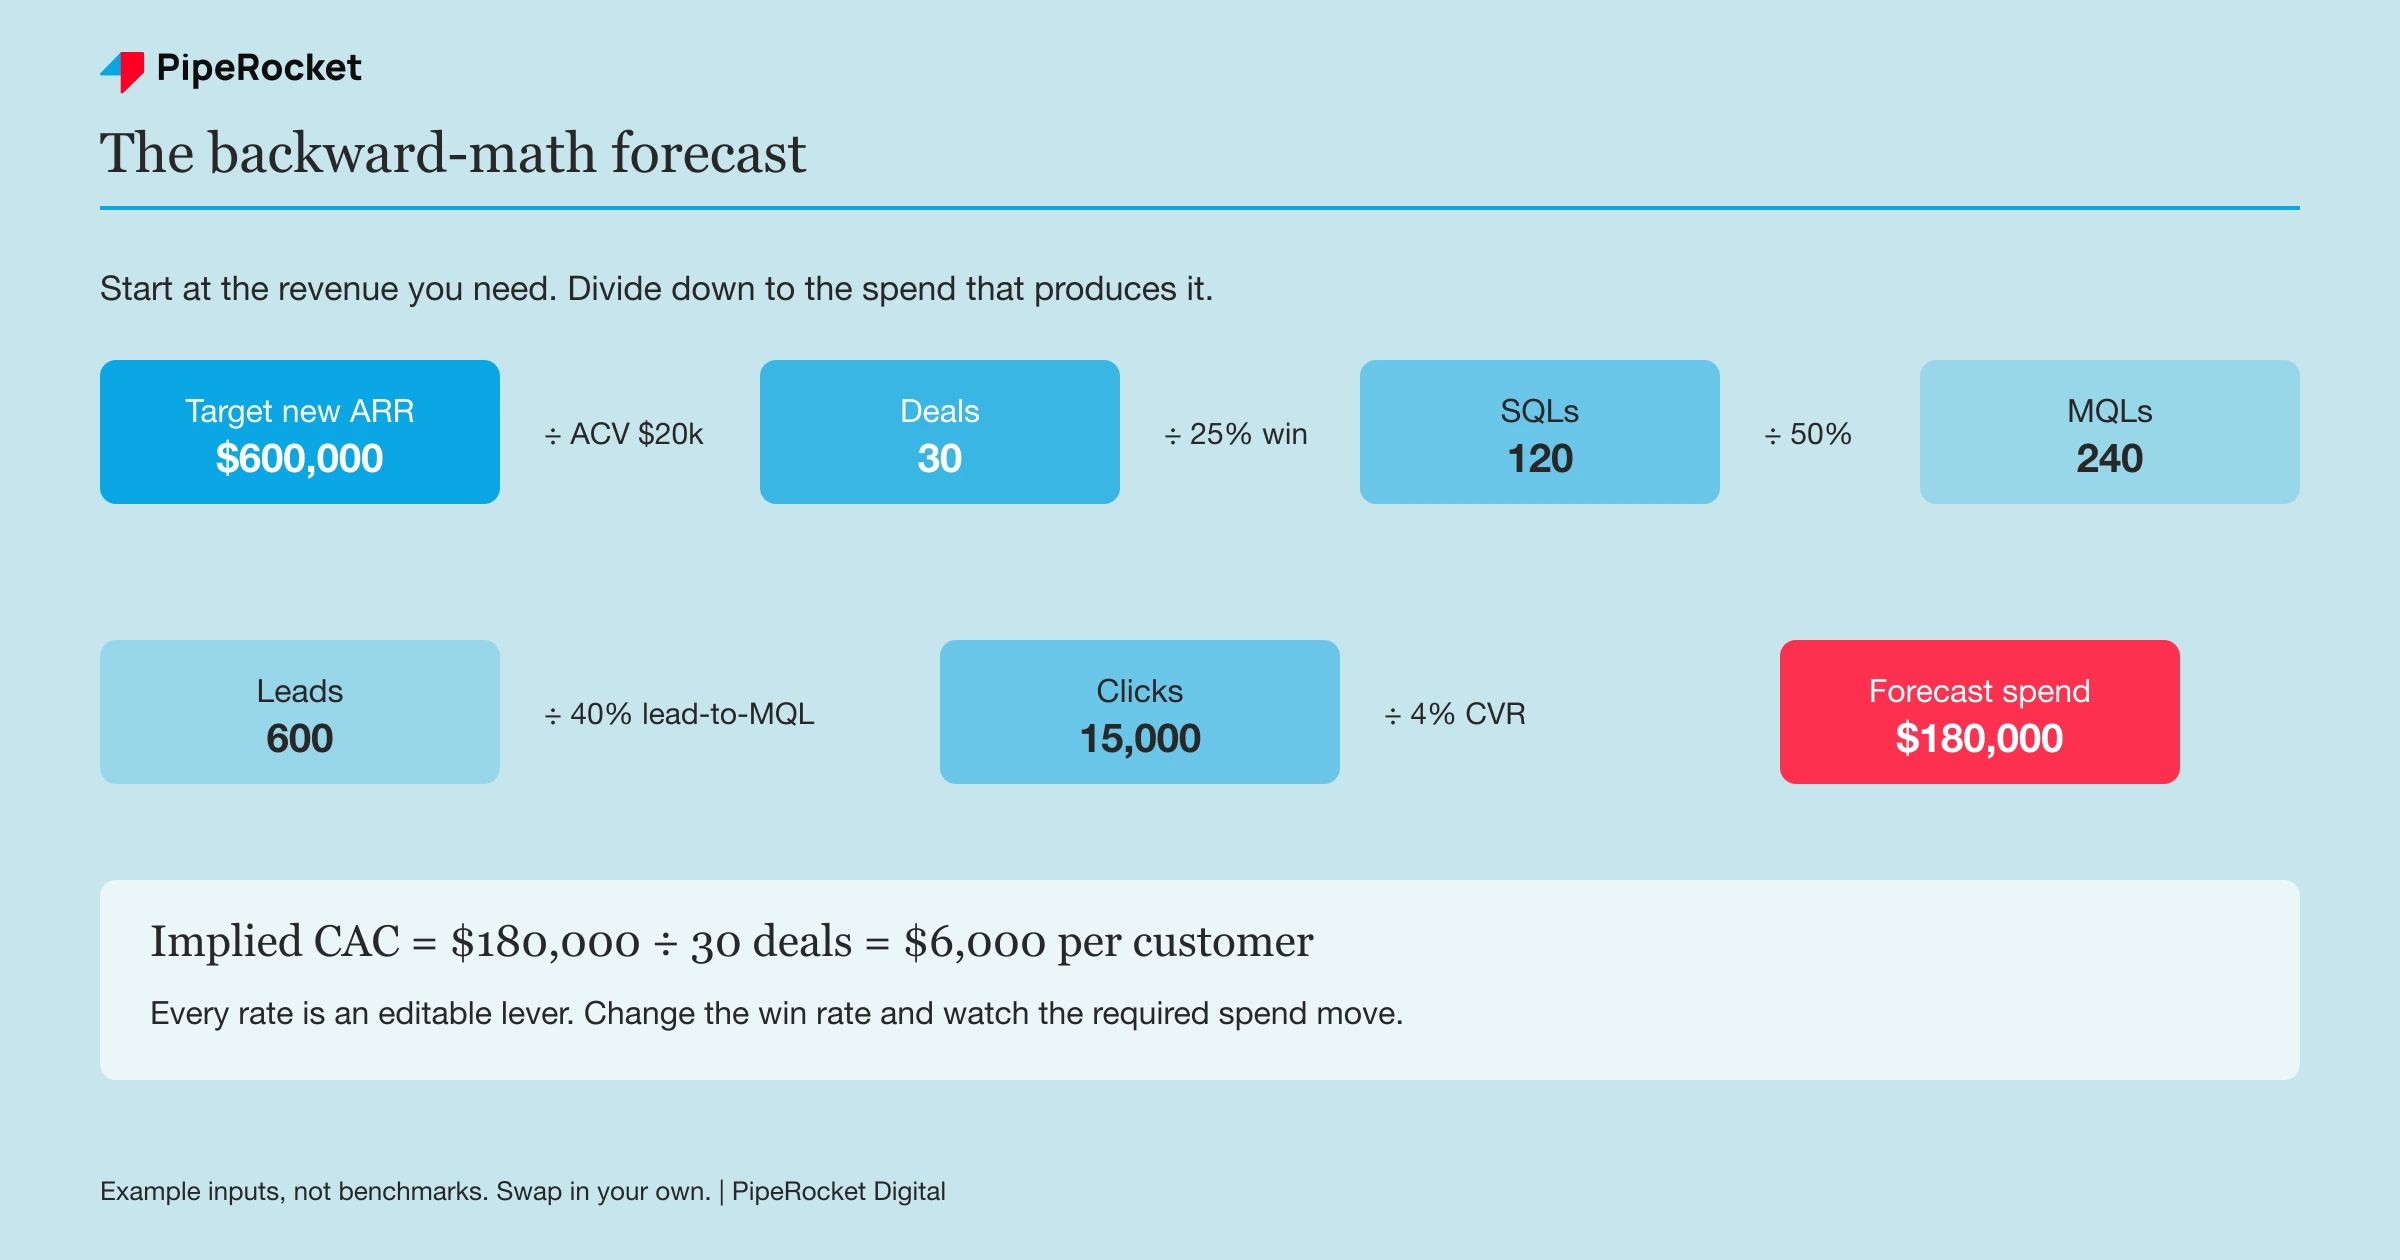
Take the new ARR you need paid search to contribute this quarter. Divide by your average contract value (ACV) to get the number of deals. Then walk that deal count back up the funnel using your conversion rates at each stage:
- Deals = target new ARR ÷ ACV
- SQLs = deals ÷ win rate
- MQLs = SQLs ÷ MQL-to-SQL rate
- Leads = MQLs ÷ lead-to-MQL rate
- Clicks = leads ÷ landing-page CVR
- Spend = clicks × average CPC
Let me put real-feeling numbers on it so you can see the shape. These are example inputs, not benchmarks, so swap in your own.
Say paid search needs to land $600,000 in new ARR this quarter and your ACV is $20,000. That’s 30 deals. At a 25% win rate you need 120 SQLs.
Keep walking it up. If 50% of MQLs become SQLs, that’s 240 MQLs. If 40% of leads become MQLs, that’s 600 leads. At a 4% landing-page conversion rate , that’s 15,000 clicks, and at a $12 CPC, that’s $180,000 in spend.
That $180,000 is a starting hypothesis, not a promise. The point is you now have a number you can argue with, because every step is visible and every assumption is one you can pressure-test.
Step 2: Gather the Five Inputs That Decide Everything
The model is only as good as the five inputs feeding it, so pull real numbers before you assume anything. Guess these and the forecast is fiction with decimal points.
Here’s what you need and where each one actually comes from:
- Average CPC. Pull it from Google Keyword Planner for your real target keyword list rather than a blended account average. BOFU terms cost more than category terms, so weight it toward what you’ll actually bid on.
- Landing-page CVR. Use your own historical rate per page type if you have it. A demo-request page converts very differently from an ebook download.
- Lead-to-SQL and win rate. These live in your CRM rather than a marketing tool. Ask sales for the real close rate on paid-sourced deals specifically, because it’s usually lower than the blended number.
- ACV. Use the average for the segment PPC targets rather than the whole book. If ads bring in SMB and your enterprise deals skew the average up, you’ll over-forecast revenue.
- Sales-cycle length. How many days from click to closed deal. This one doesn’t change the spend math, but it tells you when the revenue lands, which changes everything about how you read the results.
One warning on the CRM numbers. Paid-sourced leads almost always convert worse than inbound or referral leads, so don’t borrow your overall win rate.
If you have no historical data, that’s fine. You forecast with clearly-labelled assumptions and treat month one as a calibration run. What you can’t do is pretend a guessed 5% CVR is a known one. Our Google Ads benchmarks put average B2B SaaS CPC at $6.81 and blended cost per lead at $84 across 65+ accounts, a reasonable starting assumption until your own account has real data.
Step 3: Build the Model as One Table
Put the whole thing in a single table so anyone can trace the logic and change one lever at a time. A forecast buried in six disconnected cells is a forecast nobody trusts.
Each funnel stage is a row. Each conversion rate is an editable input. When someone questions the number, you point at the row, not at your gut. Here’s the model from Step 1 laid out the way I actually keep it:
| Stage | Conversion assumption | Result |
|---|---|---|
| Target new ARR | (starting point) | $600,000 |
| Deals needed | ÷ $20,000 ACV | 30 |
| SQLs needed | ÷ 25% win rate | 120 |
| MQLs needed | ÷ 50% MQL to SQL | 240 |
| Leads needed | ÷ 40% lead to MQL | 600 |
| Clicks needed | ÷ 4% landing CVR | 15,000 |
| Forecast spend | × $12 CPC | $180,000 |
| Implied CAC | $180,000 ÷ 30 deals | $6,000 |
The bottom row is the one that matters most. A $6,000 cost to acquire a $20,000 ACV customer is the real test, and whether that passes depends on lifetime value , which is Step 4.
Keep the conversion assumptions in their own cells and let the results calculate off them. That way, when sales tells you the real win rate is 18%, not 25%, you change one number and watch the required spend move, instead of rebuilding the sheet.
Step 4: Account for How SaaS Actually Works
SaaS breaks the standard PPC ROI math in three specific ways, and if you forecast without adjusting for them, the model will lie to you. This is the section most budget templates skip, and it’s where SaaS forecasts go wrong.
Your Spend and Your Revenue Land in Different Quarters
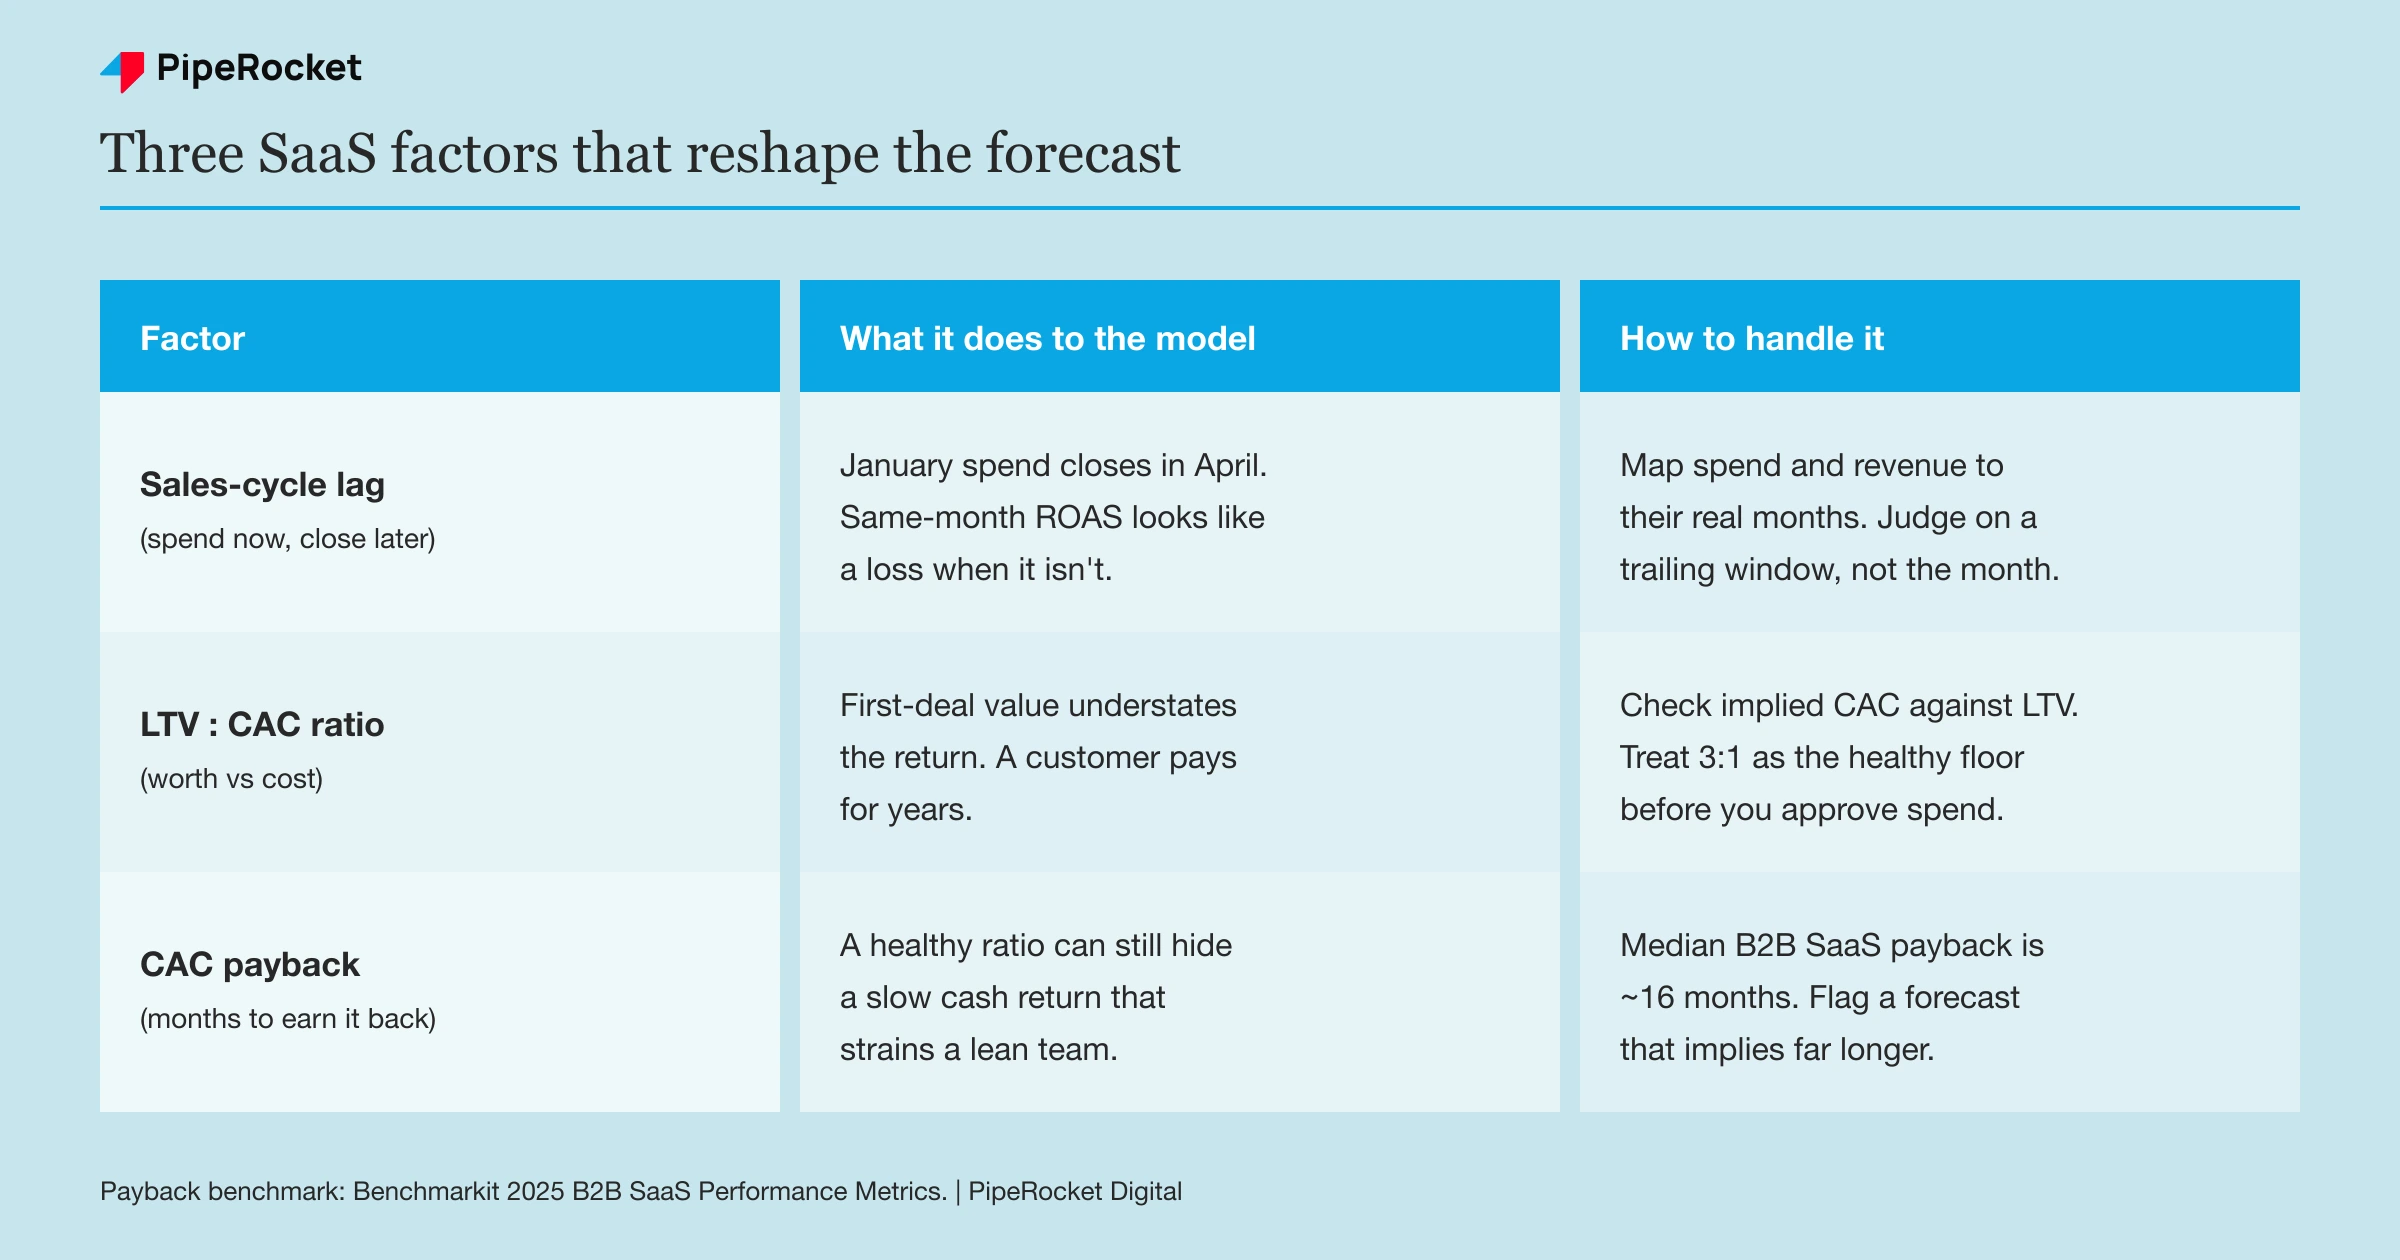
The single biggest trap is the lag. If your sales cycle runs 90 days, the money you spend in January closes in April, so January will always look like a loss if you judge it on same-month revenue.
Build the delay into the forecast explicitly. Map spend to the month it happens and map the resulting revenue to the month it’s expected to close, a quarter or two later. When you show leadership the forecast, show both curves, so nobody panics in month two when spend is up and revenue hasn’t caught up yet.
This is also why a monthly ROAS number is close to useless for early-stage SaaS PPC . You’re comparing this month’s cost to revenue from spend you made a quarter ago. Judge efficiency on a trailing window that matches your sales cycle, not the calendar month.
Judge It on LTV:CAC Over the Customer’s Whole Life
A SaaS customer pays you for years, so comparing spend to first-contract value understates the return badly. The right denominator is lifetime value, and the ratio to watch is LTV:CAC.
The rough rule most SaaS operators use is a 3:1 LTV:CAC as the healthy floor. Below that, you’re likely overpaying to acquire; well above it, you may be under-investing and leaving growth on the table. So take the implied CAC from your model and check it against LTV before you approve the spend.
In our example the CAC came out at $6,000. If that $20,000 ACV customer stays three years, LTV is comfortably past $6,000 and the ratio clears 3:1 easily. Voice the reader’s objection here: “$6,000 to get one customer sounds insane.” It isn’t, if the customer is worth $60,000 over their life.
Watch the Payback Period as a Second Gate
LTV:CAC can look healthy while your cash position quietly suffers, which is why payback period matters as a second gate. Payback is how many months of revenue it takes to earn back what you spent to acquire the customer.
Across B2B SaaS, median CAC payback sits around 16 months, with bottom-quartile teams waiting two years or more . If your PPC forecast implies a payback well past that, the channel might be profitable on paper but a cash drain in practice. For a bootstrapped or lean team, a fast payback can matter more than a beautiful long-term ratio.
Step 5: Stress-Test the Model Before You Commit
Never present a single forecast number, because a single number is a bet dressed up as a plan. Build three scenarios and show the range, so leadership approves a budget knowing what happens if the assumptions slip.
Take each conversion lever and flex it. What if CPC runs 30% higher because the auction is tougher than Keyword Planner suggested, and landing-page CVR is 2.5% instead of 4%? The same spend suddenly delivers far fewer deals.
| Scenario | CPC | Landing CVR | Win rate | Deals from $180k | Implied CAC |
|---|---|---|---|---|---|
| Optimistic | $10 | 5% | 30% | ~54 | ~$3,300 |
| Base case | $12 | 4% | 25% | 30 | $6,000 |
| Pessimistic | $16 | 2.5% | 18% | ~10 | ~$18,000 |
Those scenario numbers are illustrative, run off the same example inputs, not client data. The value is the spread. In the pessimistic case, CAC roughly triples and might blow past your LTV:CAC floor, which tells you exactly which levers to protect. If a plausible bad case breaks your unit economics, you either fix the funnel first or start smaller.
I’d rather show a client the pessimistic case up front and be pleasantly surprised than sell them the optimistic one and explain a miss later. The stress test is what turns a forecast from a sales pitch into a plan.
Step 6: Reconcile Forecast Against Actuals Every Month
A forecast you never check against reality is just a wish, so the last step is a monthly reconciliation loop. Pull actual clicks, leads, MQLs, SQLs, and deals, drop them next to your forecast, and find where the two diverge.
The gaps tell you exactly what to fix:
- CPC higher than forecast? The auction is tougher than planned. Tighten match types and negatives, or your spend buys fewer clicks than the model assumed.
- Clicks fine but CVR low? The traffic is arriving but the landing page isn’t converting it. Fix the page before you touch the budget.
- Leads fine but SQL rate low? You’re buying the wrong intent. The clicks are coming from outside your ICP .
Then re-fit the model with the real numbers. After two or three months you stop forecasting with borrowed assumptions and start forecasting with your own account’s data, which is when the model gets genuinely accurate.
This loop is the whole point. The first forecast is a hypothesis built on best guesses; the model earns its accuracy over time, once it’s been reconciled against what actually happened.
Common Mistakes to Avoid
Borrowing the blended win rate instead of the paid-sourced one
Paid-search leads almost always close at a lower rate than inbound, referral, or sales-sourced ones. If you plug your overall CRM win rate into a PPC forecast, you’ll overstate the deals and understate the CAC, and the whole model tilts optimistic before you’ve made a single assumption of your own.
Judging month-one performance on same-month revenue
With a 90-day sales cycle, the spend you make in month one closes in month four. Teams that read early PPC on same-month ROAS panic, cut the budget, and kill the channel right before the first cohort of deals would have landed. Always map revenue to when it’s expected to close.
Presenting one forecast number instead of a range
A single number hides all the risk. When the optimistic assumptions don’t hold, and some of them never do, the miss looks like failure instead of the pessimistic scenario you already planned for. Show the range, name the levers, and let leadership approve the budget with eyes open.
How PipeRocket Helps SaaS Teams Forecast Paid Spend
We build this exact model for the SaaS teams we run paid search for , backward from the pipeline number, stress-tested, and reconciled monthly against real account data. No blended assumptions, no top-down guesses, no “let’s spend and see.” If you want a forecast your CFO will actually sign off on before launch, reach out to us here and we’ll build it with your numbers.
Frequently Asked Questions
How much should a SaaS company spend on PPC?
There’s no universal percentage, and any answer that hands you one is guessing. The right spend is whatever the backward math produces: start from the new ARR you need paid search to contribute, divide down through win rate, conversion rate, and CPC, and the spend falls out of the model. If that number implies a CAC higher than your customer’s lifetime value can support, the budget is too high regardless of what a benchmark says. Forecast it from your own funnel, not a rule of thumb.
What is a good LTV:CAC ratio for SaaS?
Most SaaS operators treat 3:1 as the healthy floor, meaning a customer’s lifetime value should be at least three times what it cost to acquire them. Below 3:1, you’re likely overpaying for growth and need to fix conversion or targeting before scaling spend. Well above 3:1, say 5:1 or higher, you may actually be under-investing and leaving pipeline on the table. Pair it with payback period, because a strong ratio can still hide a slow cash return.
How do you forecast leads from a PPC budget?
Run the same math forward instead of backward. Take your budget, divide by average CPC to get clicks, multiply by your landing-page conversion rate to get leads, then apply your lead-to-MQL and MQL-to-SQL rates to get qualified pipeline. The accuracy depends entirely on the input quality, so use CPC from Keyword Planner for your real keyword list and conversion rates from your own historical data. Without history, forecast with clearly-labelled assumptions and treat the first month as calibration.