How to Calculate the Revenue Impact of a Blog Post
 Vignesh Sampath
Last updated on
Vignesh Sampath
Last updated on
Picture your blog as a list of line items on a P&L. Each post cost something to make and each one earns something back, and almost no SaaS team can tell you which posts are in the black. They can rank a post. They can’t tell you what it earned.
This is the gap I close here. Not channel-level SEO ROI, and not just finding which pages touch deals. The actual dollar figure a single post influenced, so you can decide whether it’s worth keeping.
TL;DR
- Most teams value posts by traffic, which hides the money: A 200-visitor post can out-earn an 8,000-visitor one, so a revenue number per post is the only honest way to rank your library.
- The per-post formula is three inputs from your CRM: Influenced deals times average deal value times the credit share you assign each touch equals the revenue that post influenced.
- Judge each post by its page-type benchmark: A comparison page and a definition post create revenue at completely different rates, so holding both to one number gets you bad calls.
- The number drives a keep, scale, or cut decision: Once a post has a dollar figure next to it, the next move is obvious instead of political.
- Be honest about the margin of error: These numbers are directional, not audited, so report a range and never act on one quarter of thin data.
Why Traffic Numbers Hide What a Post Actually Earned
Ranking a post by traffic tells you almost nothing about what it earned. The most-visited post in your library is often a top-of-funnel explainer that brings in students and researchers, while a quiet comparison page with a tenth of the traffic quietly touches half your closed deals. Rank by sessions and you’ll protect the wrong one.
Here’s what most teams get wrong. They assume a post’s value scales with its traffic, so they pour rewrites and promotion into whatever the analytics dashboard puts at the top. That’s backwards. A page’s revenue depends on who reads it and how close they are to buying, not how many people land on it.
Note: A keyword pulling 1,000 searches a month, even ranking top three, might send 100 clicks, and at a normal SaaS conversion rate of 2 to 4%, that’s 4 or 5 actual conversions. High volume with the wrong intent loses to low volume with buying intent every time, and the revenue number is what exposes it.
So the unit you want is dollars influenced attached to a specific URL, not sessions or leads. Once you have that, the whole library re-sorts itself, and the posts you were proud of for their traffic often drop to the bottom.
Step 1: Get the Three Inputs You Need From Your CRM
You can’t calculate a post’s revenue from analytics alone, so before any math, confirm three numbers live in your CRM. Analytics tells you what got viewed. It can’t tell you that the deal that closed last week had read your integration comparison two months earlier.
That link only exists once the pages a lead touched are stamped onto the lead record and carried through to the closed deal.
This guide assumes that wiring is already in place. If your deals don’t carry the content a buyer touched, that’s the prerequisite, and connecting organic search to your CRM pipeline is its own separate job. Here, we’re past the plumbing.
With that in place, pull these three inputs for each post you want to value:
- Influenced deals: the closed-won deals whose buyers touched this specific page on the way in, over a fixed window like 90 days.
- Average deal value: your real ACV from the CRM, not a round number someone guessed in a meeting.
- Credit share: how much of each deal you assign to this one touch, since a buyer reads several pages before they sign.
That last input is where teams either overthink it or skip it. You don’t need a perfect attribution science. You need a consistent rule, applied the same way to every post, so the comparison between posts is fair.
Step 2: Run the Per-Post Revenue Formula
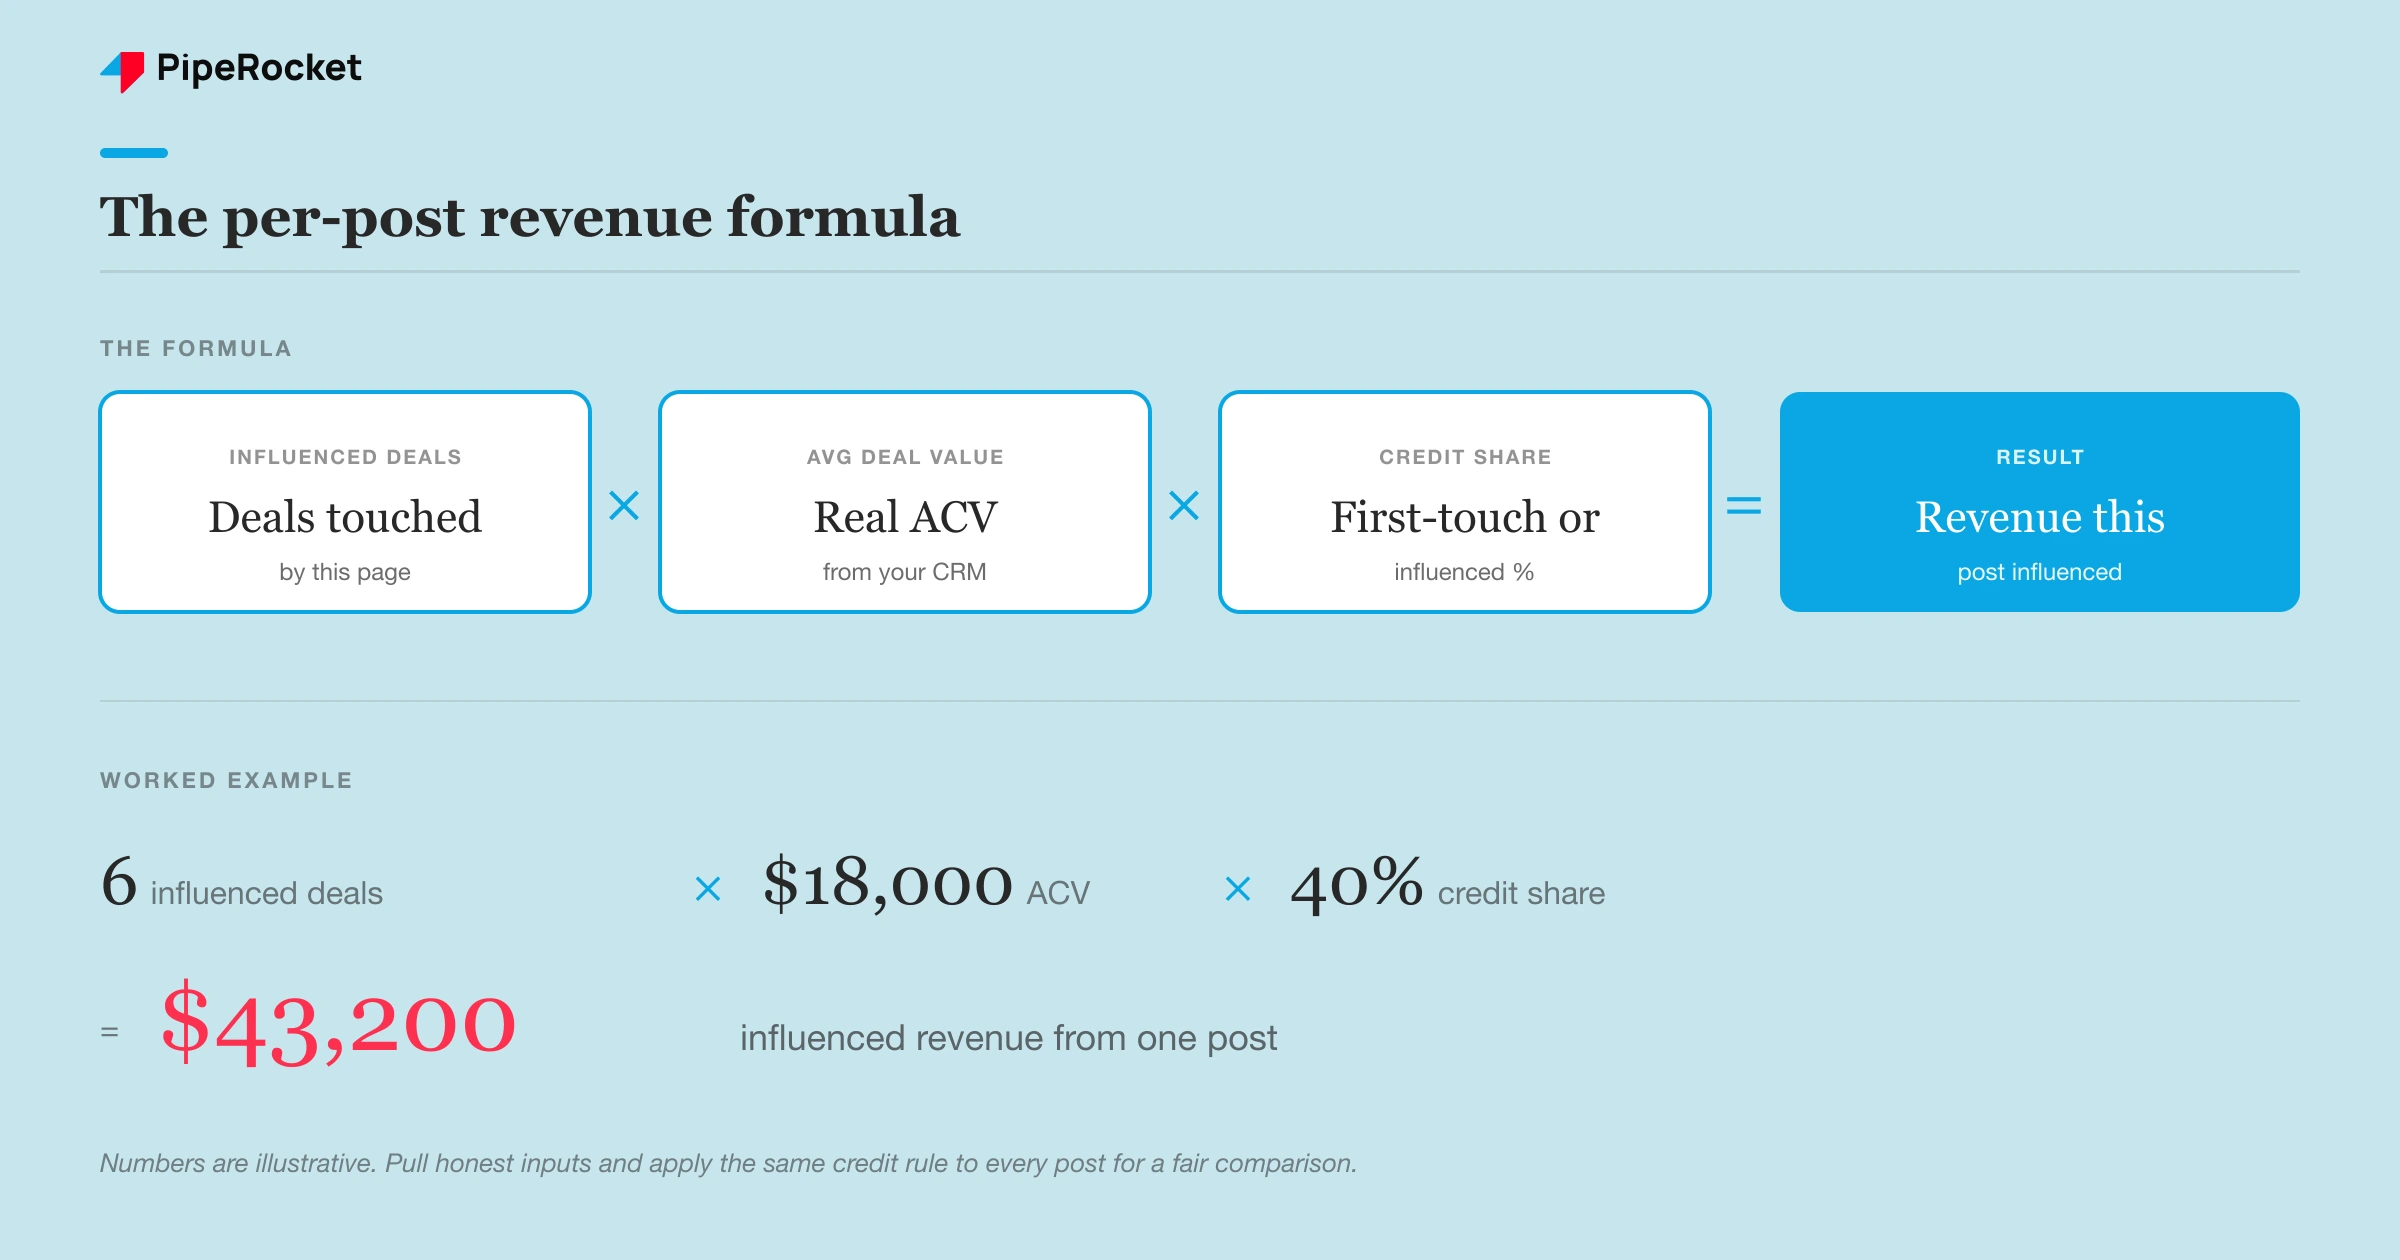
The formula itself is simple: influenced deals times average deal value times credit share equals the revenue that post influenced. The discipline is in pulling honest inputs and applying the same credit rule everywhere, so a definition post and a pricing page get measured on the same scale.
Credit share is the input that needs a decision up front. Two simple rules cover most SaaS teams:
- First-touch credit: the post that brought a buyer in gets the credit. Best for valuing how content opens pipeline.
- Influenced (even or weighted) credit: every page a buyer touched shares the deal. Best for valuing the middle of the funnel that closes deals but rarely starts them.
Pick one and stick to it across the whole library for that report. Mixing first-touch on one post and multi-touch on another gives you numbers you can’t line up against each other, which defeats the point.
Take a compliance SaaS for fintech teams. Their busiest post was a regulation explainer pulling thousands of visitors. Run the formula and it influenced almost no closed deals, so its revenue number was tiny. A quiet “X vs Y” page with a fraction of the traffic touched several deals at a high ACV, and its number dwarfed the explainer’s.
That inversion is the entire reason to do this. The post you’d never promote on a traffic chart is often the one carrying real money.
Step 3: Judge Each Post Against Its Page-Type Benchmark
A revenue number means nothing until you compare it to what that page type should earn. A comparison page and a definition post have completely different jobs, so they produce revenue at completely different rates. Score them against the same bar and you’ll cut the wrong posts.
Our team reports conversion by page TYPE, never as one blended number, because the benchmarks are so far apart:
| Page type | Job | Typical conversion | Revenue expectation |
|---|---|---|---|
| Pricing / comparison / alternative | Closes the deal | ~3-4% | High revenue per visitor |
| Use-case / integration | Mid-funnel, demo-led | Moderate | Moderate, often assisted |
| How-to / strategy posts | Assists the deal | Lower | Low direct, real influence |
| Definition / top-of-funnel | Builds the audience | ~0.75% | Low direct, feeds others |
A definition post influencing very little direct revenue isn’t failing. Its job is to feed the comparison page that closes. The failure is judging it against a comparison page’s bar and cutting it because the dollar figure looks small in isolation.
This is the move that separates a real revenue read from a spreadsheet that just averages your best and worst content into a meaningless middle. The benchmark is the context that makes the number mean something.
Step 4: Decide to Keep, Scale, or Cut Each Post
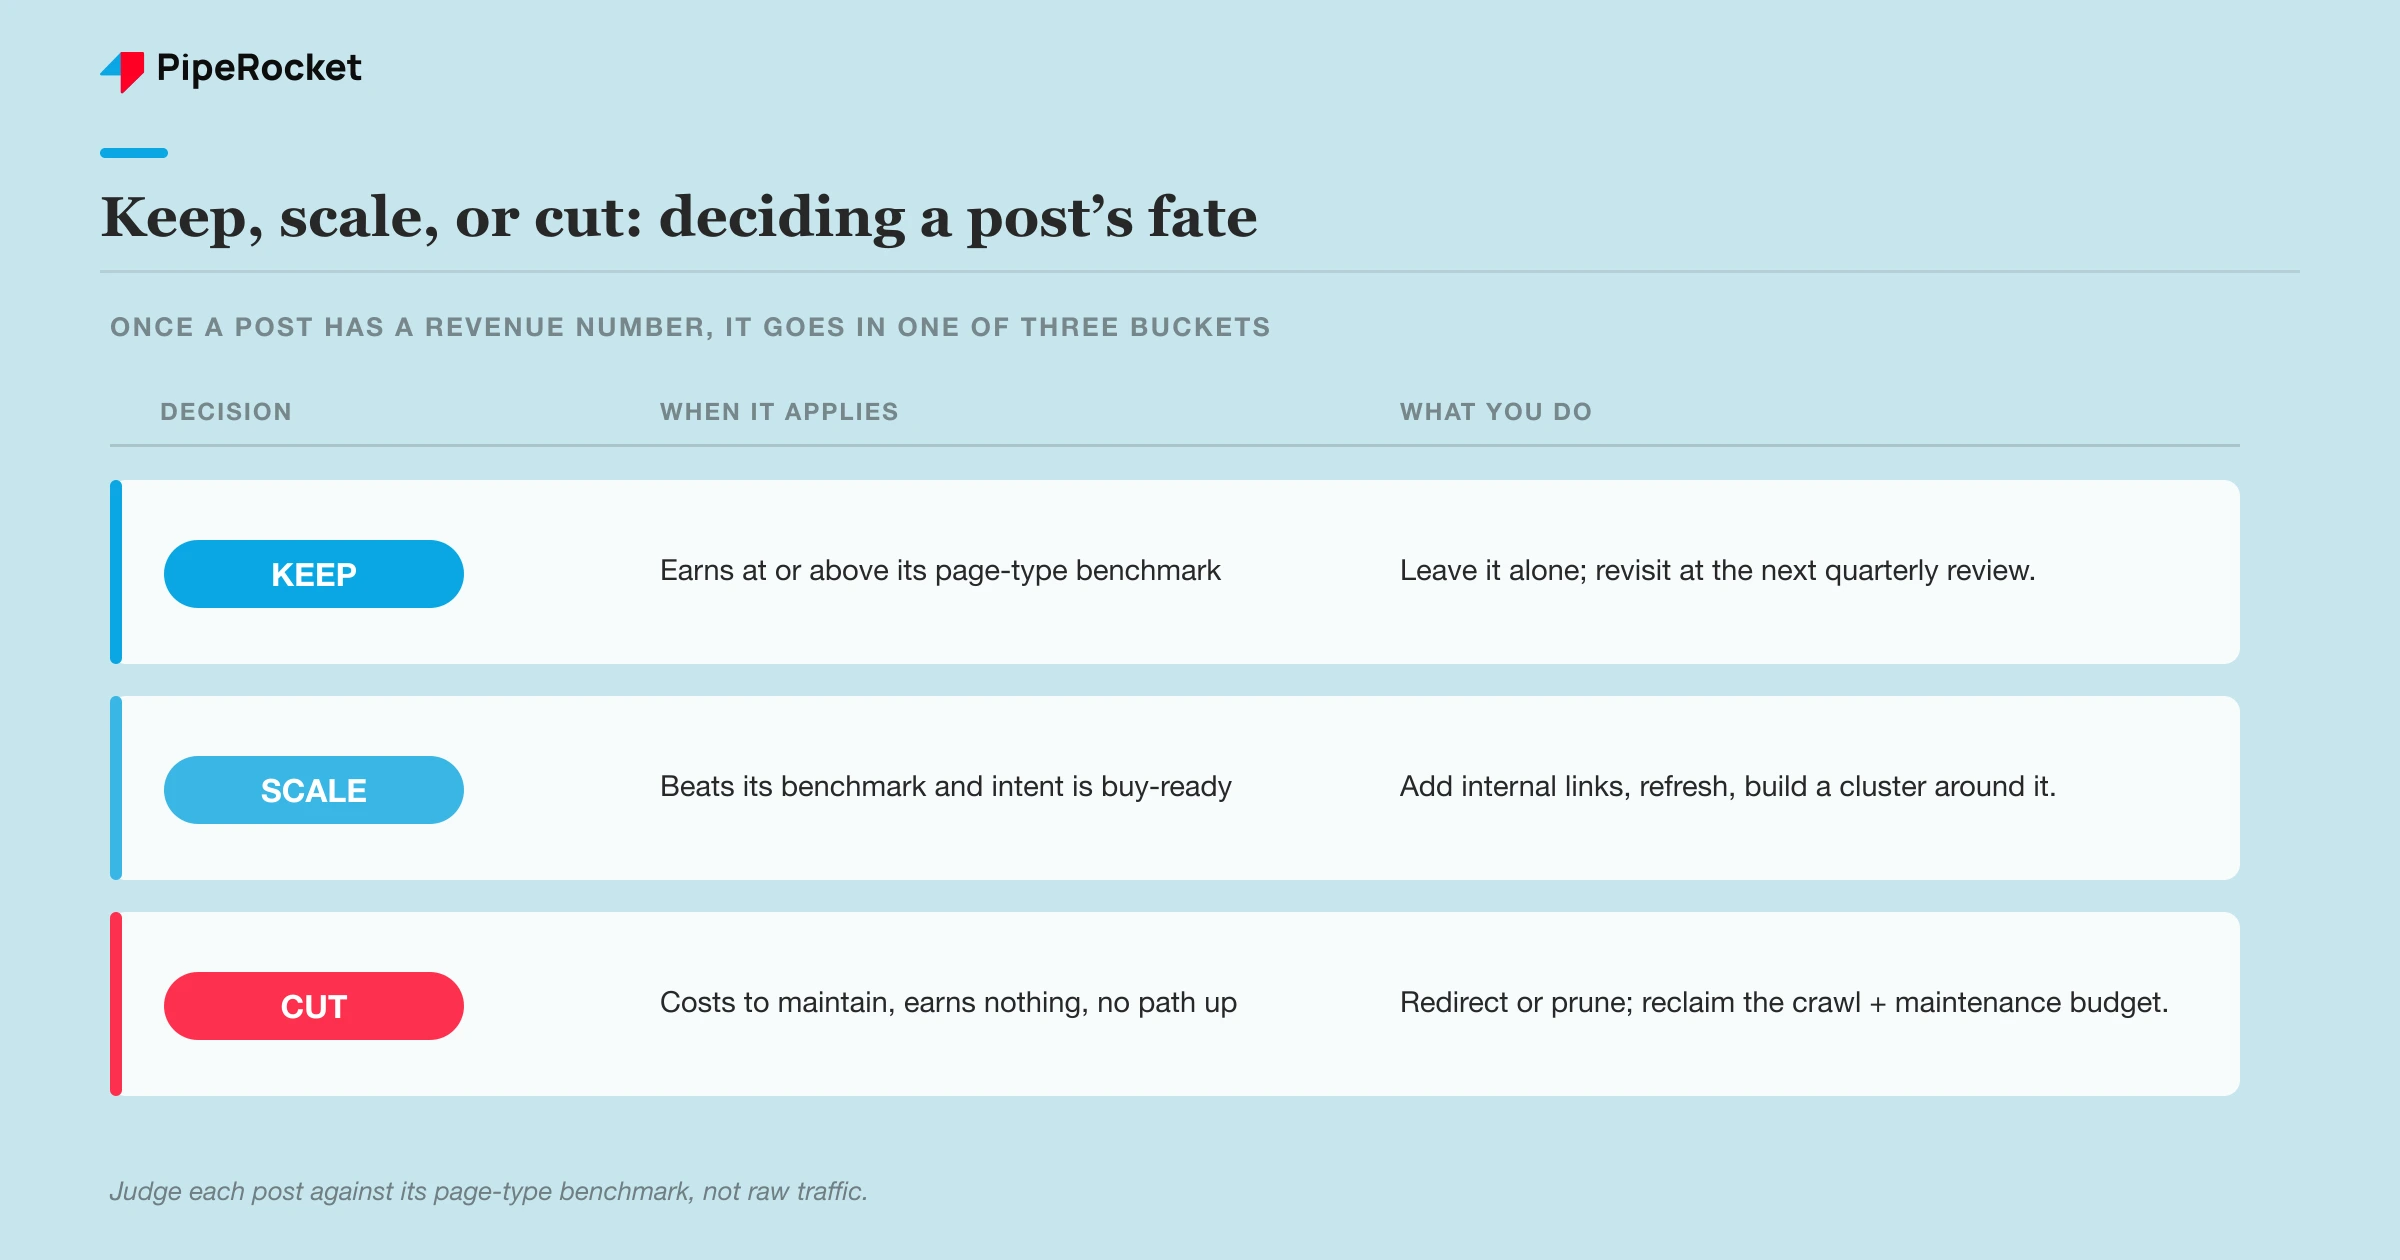
The whole point of a revenue number is the decision it forces. Once a post has a dollar figure next to it, judged against its page-type benchmark, what to do with it stops being a debate and becomes a read of the data. Every post in your library falls into one of three buckets.
Here’s how we read each bucket:
- Keep: steady influenced revenue, earning more than it costs to maintain. Low traffic is fine if the buyers are right. Leave it alone and protect the ranking.
- Scale: high revenue per visitor and close to the buying decision, with related queries you don’t own yet. This is where the next investment goes, with sharper CTAs and internal links pointing in.
- Cut or merge: lots of traffic, near-zero influenced revenue, no buyers, and a maintenance cost it never pays back. Merge it into a stronger page or redirect it.
The scale bucket is the one to act on first, because it’s connected to the search intent that actually drives pipeline. We have seen a single quietly-converting use-case page outproduce a high-traffic explainer on pipeline, just by shifting attention from high-volume pages to the low-volume, high-intent ones where decision-makers were searching. Most of those pages got 5 to 10 visitors a week, almost all qualified.
The honest trade-off here: this rewards depth over volume, which is a hard sell when leadership counts posts shipped. A program that scales four revenue-producing posts will out-earn one publishing twelve that influence nothing.
Be Honest About the Margin of Error
These numbers are directional, not audited, and anyone who tells you they’ve got per-post revenue figured out to the dollar is fooling themselves. Attribution is genuinely broken right now. A real share of buyer research happens on channels you can’t track, cookies are disappearing, and a growing slice of discovery happens inside AI tools that never pass a referrer.
So treat the revenue figure as evidence, not a verdict. It’s accurate enough to rank your library and make keep-scale-cut calls. It is not accurate enough to put in a board deck as a hard number without a range around it.
Two guardrails keep these numbers honest:
- Report a range, not a point. “This post influenced roughly $30K to $50K last quarter” is truthful. “$43,200” pretends to a precision you don’t have.
- Don’t act on thin data. With a handful of deals, one big contract can make a mediocre post look like the hero. Let volume build before you cut anything on the strength of one quarter.
The number’s job is to change the conversation from “how much traffic did this get?” to “what did this earn?” It doesn’t have to be perfect to do that. It has to be consistent.
Common Mistakes That Make Per-Post Revenue Lie
The most common mistake is valuing a post on last touch only. The form-fill page gets all the credit and the comparison page that did the convincing three weeks earlier gets none, so you defund the content that was actually working. Pick a credit rule that sees the whole path and apply it everywhere.
A close second: mixing credit models across posts in the same report. First-touch on one, multi-touch on another, and now your numbers can’t be lined up against each other. Inconsistent rules produce a ranking you can’t trust.
Two more that quietly cost you money:
- Crediting traffic instead of revenue. The highest-traffic post is rarely the highest-revenue post, and scaling it just grows an audience that never buys.
- Treating the number as exact. A directional estimate dressed up as a precise figure gets challenged the first time someone checks it, and then the whole exercise loses credibility.
Warning: don’t use a thin revenue read to cut a top-of-funnel post that feeds your money pages. Its direct revenue will always look small. Trace whether it passes readers into the pages that close before you kill it.
How PipeRocket Calculates Content-Level Revenue
We build SaaS SEO programs around the posts that earn, not the ones that rank. That means putting a real revenue figure on individual pages, judging each against its page-type benchmark, and making the keep-scale-cut call on evidence instead of traffic charts.
If your blog pulls sessions but you can’t say what any post earned, talk to our team or see how we run SaaS SEO . We work to one standard: own the outcome, not the output.
Frequently Asked Questions
How do you calculate the revenue a single blog post generated?
You multiply three numbers from your CRM: the closed-won deals whose buyers touched that post, your average deal value, and the credit share you assign to that one touch. The result is the revenue that post influenced over your reporting window.
The hard part isn’t the math, it’s having the pages a buyer viewed stamped onto the deal record so you can trace it back. Without that wiring in your CRM, analytics alone can’t tie a specific post to a specific closed deal.
What’s the difference between a post’s revenue and its traffic?
Traffic is how many people landed on the page. Revenue is how much closed-won business it influenced, which depends on who read it and how close they were to buying. A definition post can pull thousands of visitors and influence almost no deals, while a comparison page with a fraction of the traffic touches several high-value ones. That’s why ranking your library by revenue, not sessions, often flips which posts look most valuable.
How accurate are per-post revenue numbers?
They’re directional, not audited. Modern attribution is genuinely broken, since a real share of buyer research happens on untracked channels, cookies are fading, and AI tools increasingly answer buyers without sending a trackable visit.
So treat the figure as strong enough to rank posts and make keep-scale-cut decisions, but report it as a range rather than a single precise number. Don’t act on a thin quarter where one big deal can distort which post looks like the winner.