
A SaaS team tracking thirty metrics on a dashboard usually can’t tell you which three moved revenue last quarter. Tracking everything is how you end up reporting nothing useful. A handful of marketing metrics actually tie back to pipeline and revenue, and the rest are vanity that fill slides and impress no one who reads a P&L. Here’s the set worth tracking, grouped so you can build a dashboard that means something, plus the metrics you should stop reporting.
TL;DR
- Most metrics are noise: A handful of marketing metrics tie to revenue; tracking thirty of them is how you end up reporting nothing that matters.
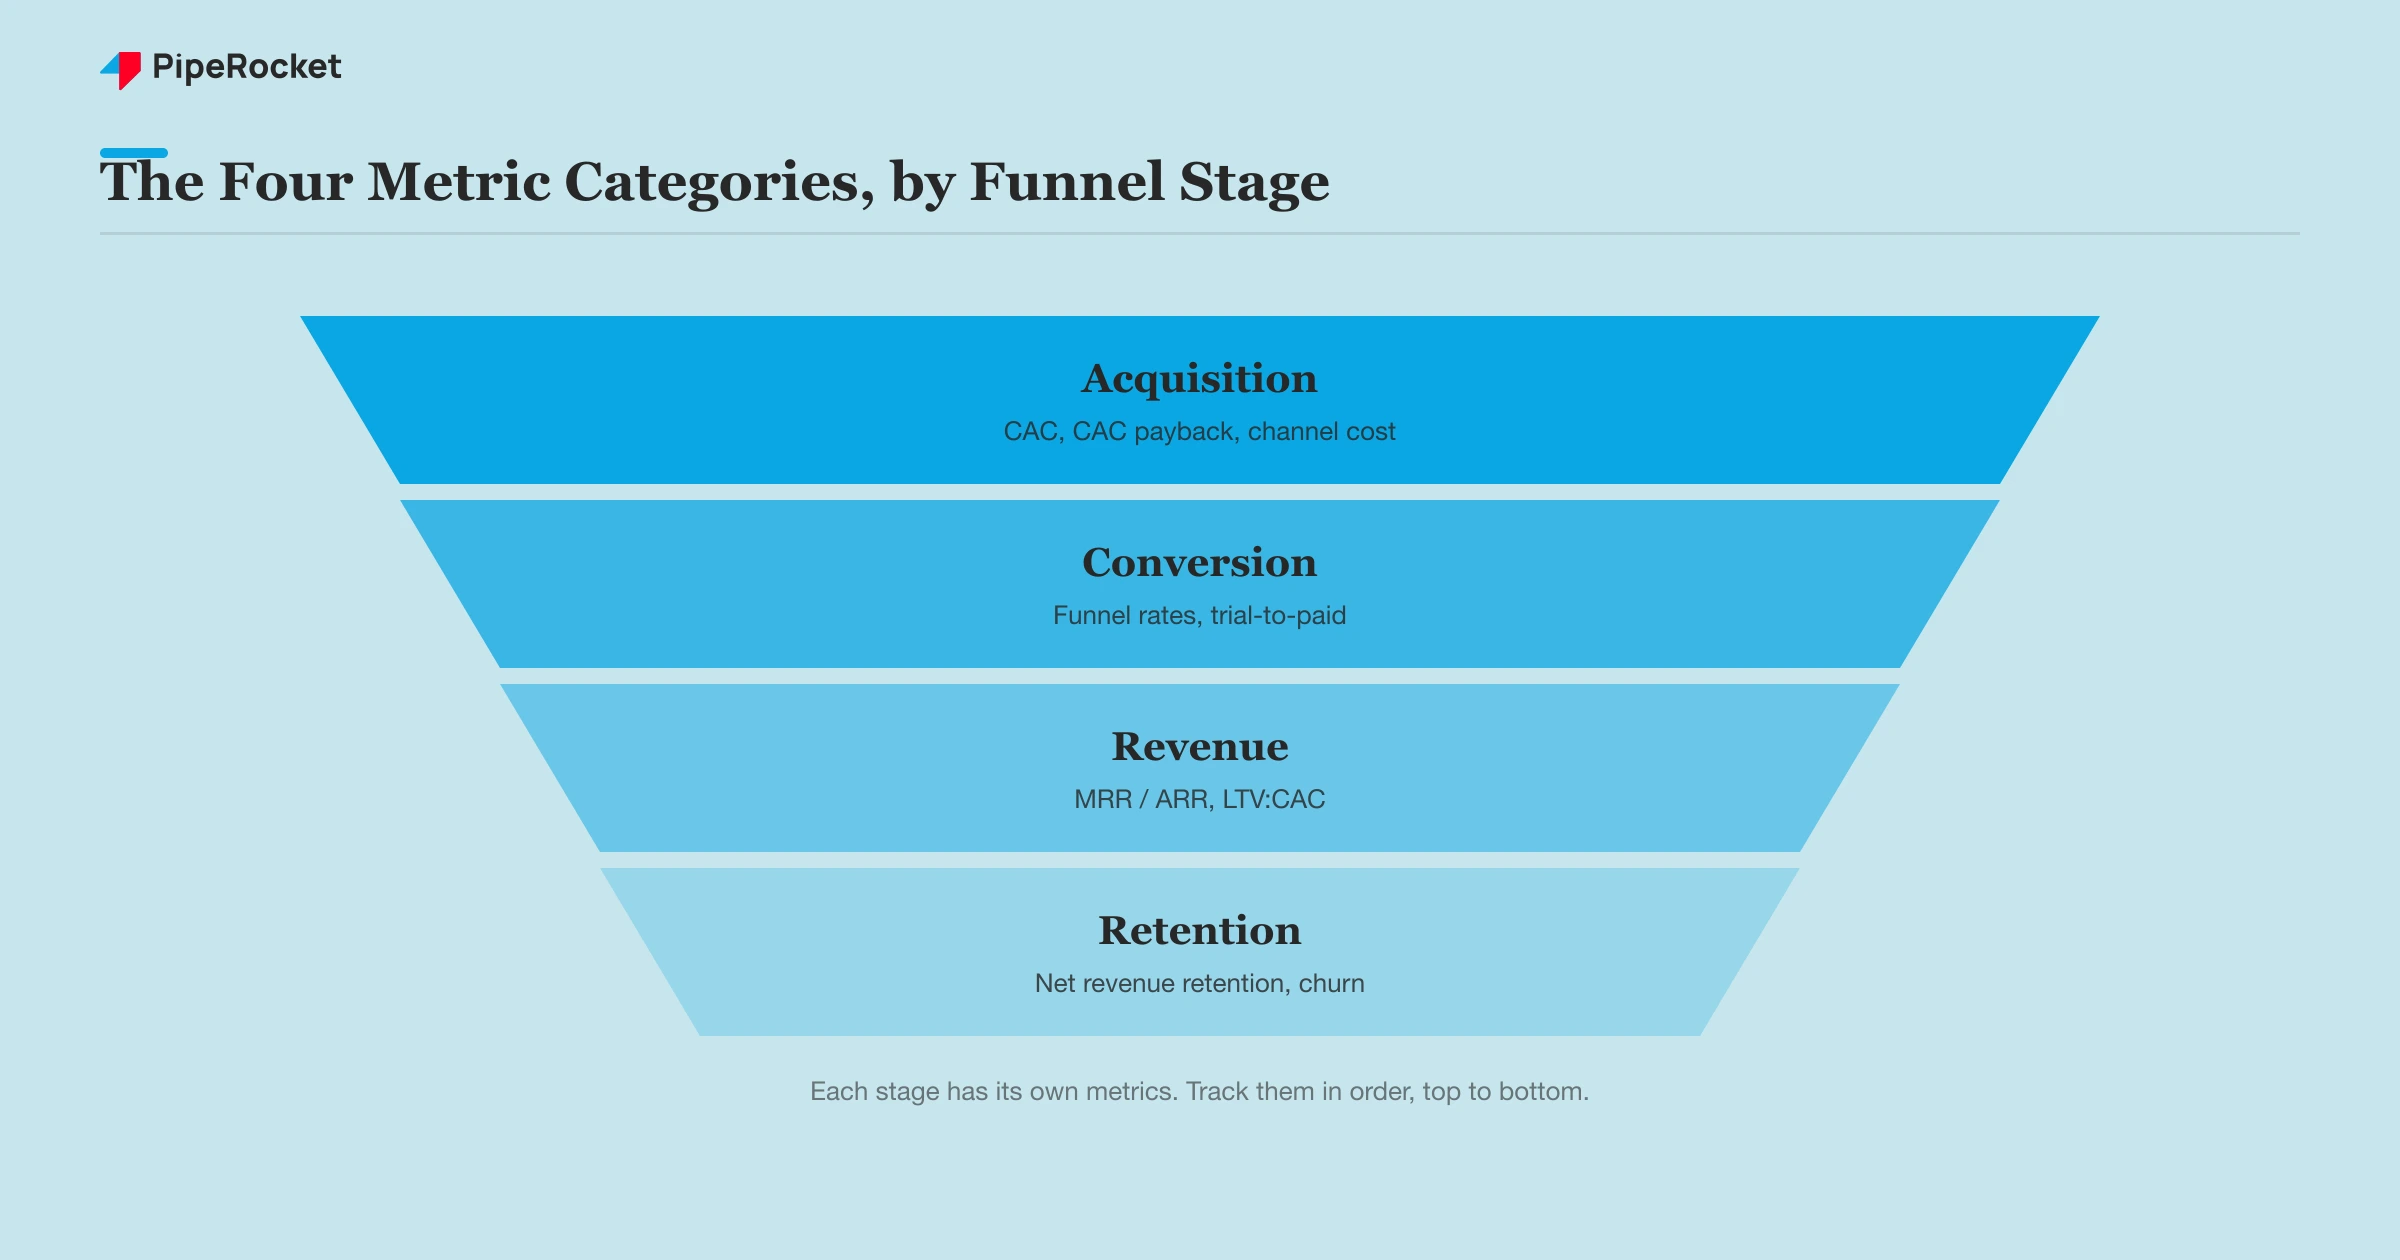
- Acquisition metrics answer cost-to-acquire: CAC and CAC payback period, segmented by channel, tell you what a customer costs and which channels actually work.
- Conversion metrics find the leak: Stage-by-stage funnel rates and trial-to-paid show exactly where pipeline is being lost.
- Revenue and retention metrics matter most: MRR/ARR, LTV:CAC, and net revenue retention are the numbers a board and a CFO actually care about.
- Stop reporting vanity: Raw traffic, impressions, followers, and email opens are activity, not outcomes, and they crowd out the metrics that count.
What Are SaaS Marketing Metrics?
SaaS marketing metrics are the numbers that measure how marketing drives customer acquisition, revenue, and retention. They cover what it costs to win a customer, how well the funnel converts, and how much revenue marketing influences over time.
They overlap with product and sales metrics but aren’t the same. Product metrics track usage and activation inside the app, and sales metrics track the deal cycle. Marketing metrics connect spend to pipeline. The trap most teams fall into is treating every measurable number as a metric worth reporting, when the job is to connect dollars in to revenue out, not to count activity.
Acquisition Metrics That Matter
Acquisition metrics answer one question: what does it cost to get a customer, and from where. Get these right and you know which channels to fund. Get them wrong, usually by measuring leads instead of customers, and you scale the channels that look cheap but never close.
Customer acquisition cost (CAC)
CAC is your fully loaded cost to acquire one customer: ad spend, tools, agency fees, and the salaries of the people doing the work, divided by the number of new customers in the period. The number most teams report is cost per lead, then they call it CAC. That’s the miscalculation that hides a broken funnel, because cheap leads that never convert make acquisition look efficient when it isn’t.
CAC payback period
CAC payback is the number of months it takes to recover that acquisition cost from a customer’s gross-margin revenue. It matters more than CAC alone because it’s a cash-flow metric, not a vanity ratio. A common benchmark is recovering CAC inside 12 months for a healthy SaaS, though it varies by deal size and motion. The longer the payback, the more cash you tie up to grow.
Channel-level attribution
Blended CAC across all channels hides which ones actually work. One channel can carry an efficient number while another quietly burns budget, and the blended average makes both invisible. Segment CAC by channel, or you’re optimizing blind and likely defunding the channel that converts best.
Conversion Metrics: Where Pipeline Is Won or Lost
Conversion metrics show where the funnel leaks, and a single stage usually explains a stalled pipeline. When traffic is up but revenue is flat, the answer is almost always one conversion step doing the damage, not a broad failure across the funnel.
Funnel conversion rates by stage
Track the rate at each step, not just the top and bottom:
- Visitor to lead
- Lead to MQL, then MQL to SQL
- SQL to closed-won
Measuring each stage separately is what lets you find the leak. A healthy top of funnel feeding a broken trial experience looks fine on a traffic chart and terrible on a revenue chart, and only the stage-by-stage view tells you which one to fix.
Trial-to-paid and signup-to-activation
For product-led SaaS, these two conversions decide your revenue. Signup-to-activation measures whether new users reach the moment the product clicks, and trial-to-paid measures whether that turns into money. A product-led company with a weak activation rate has a leak no amount of top-of-funnel traffic will fix, so these belong on the core dashboard, not in a product silo.
Revenue and Retention Metrics
These are the metrics a CFO and a board actually care about, and marketing should be able to speak them fluently. If your reporting stops at leads and never reaches recurring revenue, you’re handing the revenue conversation to finance and sales by default.
MRR and ARR
Monthly and annual recurring revenue are the base everything else ladders up to. MRR is the predictable subscription revenue you book each month, and ARR is its annualized form. Marketing’s job is to show its contribution to new and expansion MRR, not just to count the leads that fed it.
Customer lifetime value and LTV:CAC
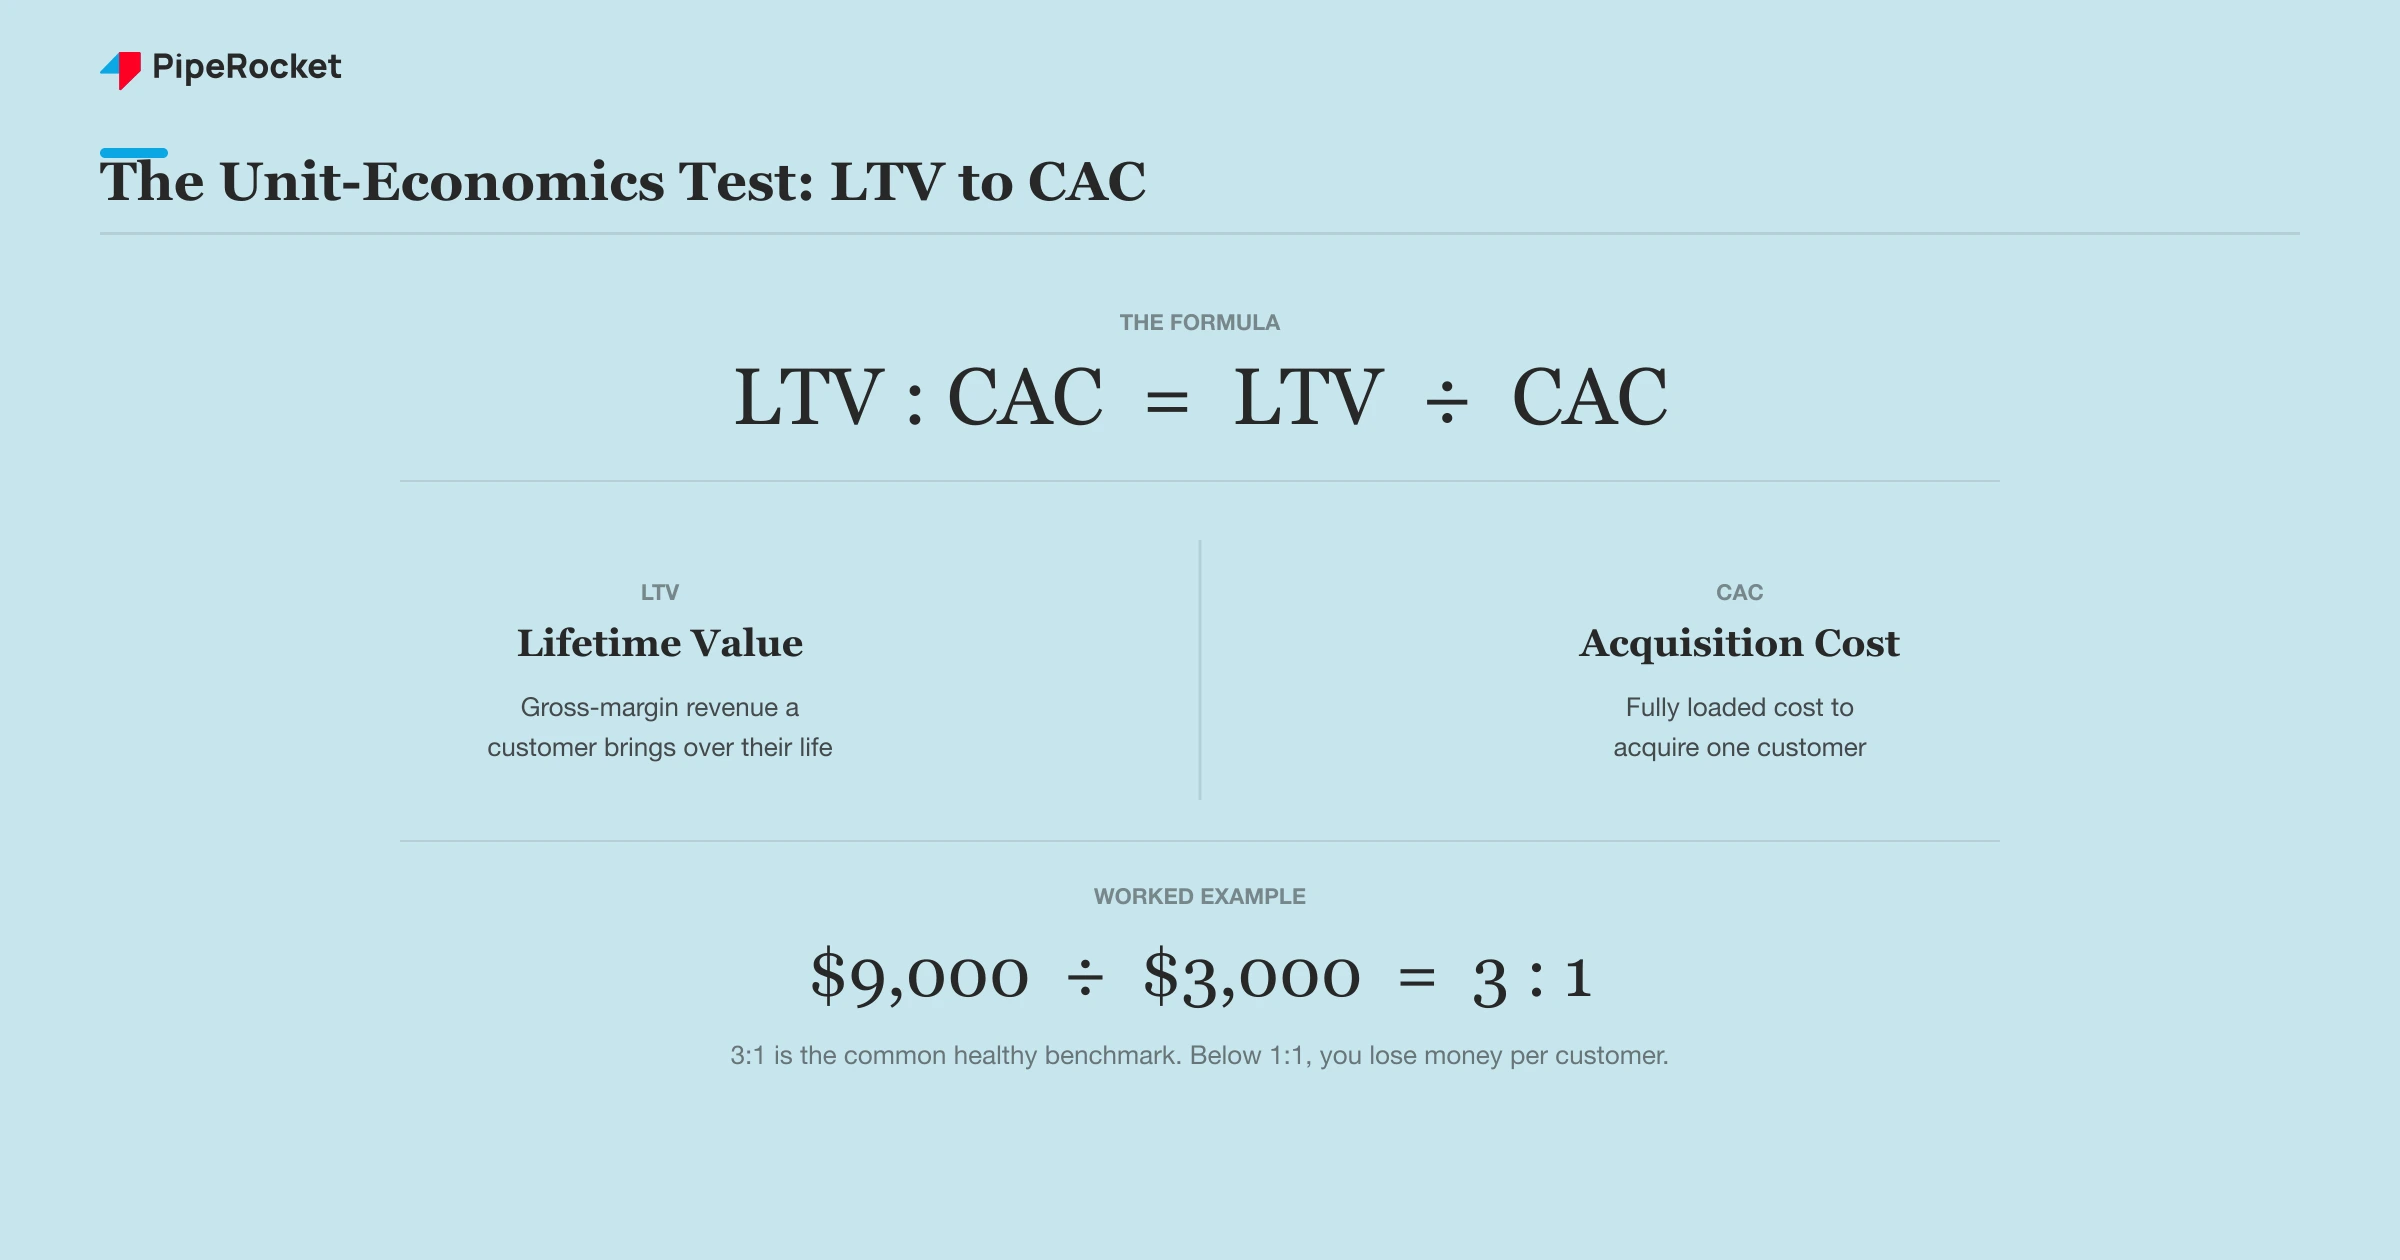
LTV is the gross-margin revenue you expect from a customer over their lifetime, and the LTV:CAC ratio is the unit-economics test of whether acquisition is sustainable.
The widely cited rule of thumb is 3:1, meaning a customer is worth roughly three times what you paid to acquire them. Below 1:1 you lose money on every customer, and far above 3:1 often means you’re underinvesting in growth. Treat LTV as an informed estimate, not a precise figure, because it rests on assumptions about lifetime and churn that change.
Net revenue retention and churn
Churn is the revenue you lose from cancellations and downgrades, and net revenue retention (NRR) folds in expansion from existing customers. NRR above 100% means your installed base grows even if you add no new customers, which is why retention often beats acquisition as a SaaS growth lever. A leaky bucket doesn’t get fixed by pouring in more leads, and these two metrics are what expose the leak.
The Vanity Metrics to Stop Reporting
Some metrics fill dashboards and impress no one who reads a P&L. They feel like progress because they go up and to the right, but they don’t connect to revenue, and reporting them crowds out the numbers that do.
The framing we keep coming back to is simple: stop chasing traffic, start chasing signals. A metric earns its place on the board deck only if you can trace a line from it to pipeline.
Raw traffic, impressions, and followers
These measure activity, not outcomes. Traffic that doesn’t convert is a cost, not a win, and a follower count has never closed a deal. They’re worth watching as diagnostic inputs, but they don’t belong in a revenue conversation, and presenting them as results is how marketing loses credibility with finance.
Email opens and generic engagement
Open rates are easy to game and weakly tied to revenue, and privacy changes like Apple Mail’s pre-loading have inflated them to the point of near-meaninglessness. Generic “engagement” scores have the same problem: they bundle low-intent activity into a number that feels meaningful and tells you almost nothing about pipeline. Track replies, clicks to high-intent pages, and conversions instead.
Which Metrics Belong in Front of the Board
A board wants four or five numbers that connect marketing to revenue, not a thirty-row dashboard. Pick the metrics that show pipeline contribution and unit economics, and leave the diagnostic detail for your team’s working dashboard.
| Board-grade metric | What it answers |
|---|---|
| Marketing-influenced pipeline | How much revenue marketing is sourcing or touching |
| CAC and CAC payback | What a customer costs and how fast you recover it |
| LTV:CAC ratio | Whether acquisition is economically sustainable |
| Net revenue retention | Whether the base is growing on its own |
| New and expansion MRR | Marketing’s direct contribution to recurring revenue |
Five numbers a board can act on beat thirty it has to wade through. If a metric can’t answer a revenue question someone in that room is asking, it stays on the working dashboard, not the board slide.
How PipeRocket Digital Reports SaaS Marketing
We report against pipeline and revenue, not vanity dashboards. That means tying organic and paid work to influenced pipeline, CAC, and the recurring-revenue metrics a board actually reads. Marketing earns its seat in the revenue conversation that way. If your reporting stops at traffic and leads, see how we run SaaS SEO , or talk to our team and we’ll help you build reporting that connects to revenue.
Frequently Asked Questions
What are the most important SaaS marketing metrics?
The ones that connect spend to revenue: customer acquisition cost (CAC) and CAC payback period, funnel conversion rates, LTV:CAC, and net revenue retention. For most SaaS teams, marketing-influenced pipeline is the single most important number, because it shows how much revenue marketing is actually sourcing rather than how much activity it’s generating. Everything else is either a diagnostic input or, in the case of raw traffic and followers, vanity.
What is a good LTV:CAC ratio for SaaS?
The widely cited rule of thumb is 3:1, meaning a customer is worth about three times what you spent to acquire them. Below 1:1 you’re losing money on every customer, and a ratio far above 3:1 often signals you’re underinvesting in growth and could afford to acquire more aggressively. Treat it as directional guidance rather than a hard target, since LTV depends on assumptions about customer lifetime and churn that shift over time.
What’s the difference between a vanity metric and an actionable metric?
A vanity metric goes up and to the right and feels like progress but doesn’t connect to a decision or to revenue, like raw traffic, impressions, or follower count. An actionable metric tells you what to do next and ties to an outcome, like a trial-to-paid rate that points to a conversion problem or a channel CAC that tells you where to shift budget. The test is simple: if the number changes, does anything in your strategy change? If not, it’s vanity.