
Picture this: your VP of Marketing asks how much pipeline SEO will source next year, and she wants a number for the board deck by Friday. Proving what organic already did is the easy part. Projecting what it hasn’t done yet, on rankings that don’t exist, is where most SEO forecasts either lie or chicken out.
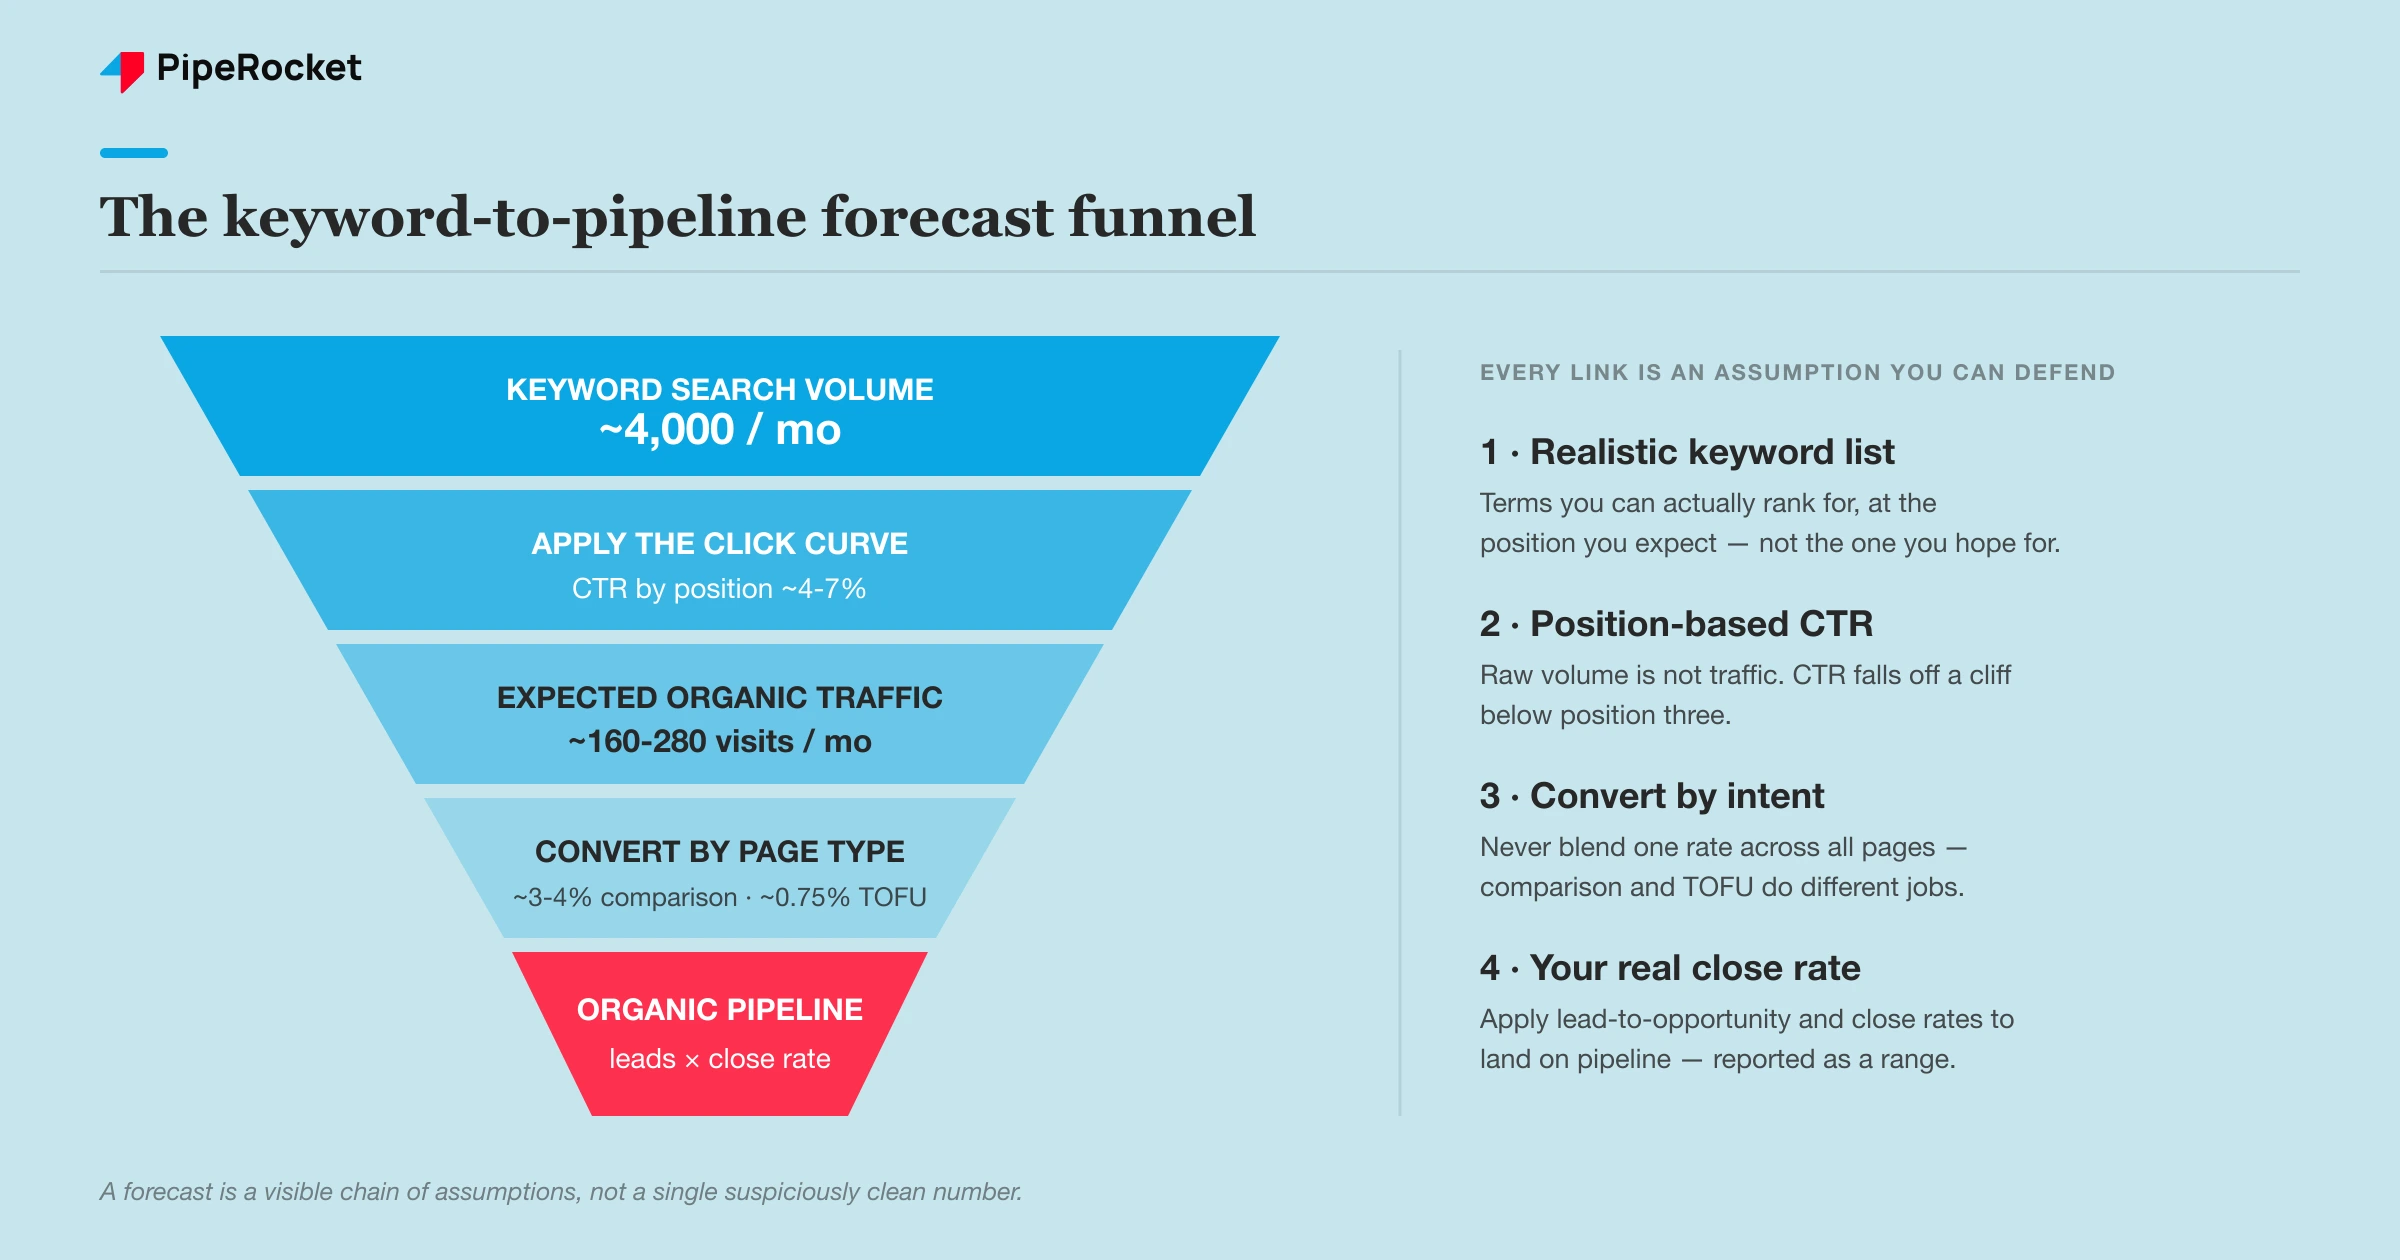
Here’s the model we use to forecast organic-sourced pipeline without overpromising: start from keyword volume, walk it down through traffic, conversions, and close rate, and report a range instead of one suspiciously clean figure.
TL;DR
- A forecast is a chain of assumptions, not a guess: You’re projecting volume to traffic to conversions to pipeline, and every link is an assumption you have to be able to defend out loud.
- Build it bottom-up from a real keyword list: Forecast page by page off keywords you can realistically rank for, not a top-down “we’ll grow traffic 30%” wish.
- Apply the click curve, not the search volume: Only a slice of monthly searches ever clicks through to position three or four, so model expected position honestly.
- Convert by page type, then close by your real rates: A comparison page and a top-of-funnel post convert at different rates, so never run one blended number through the whole funnel.
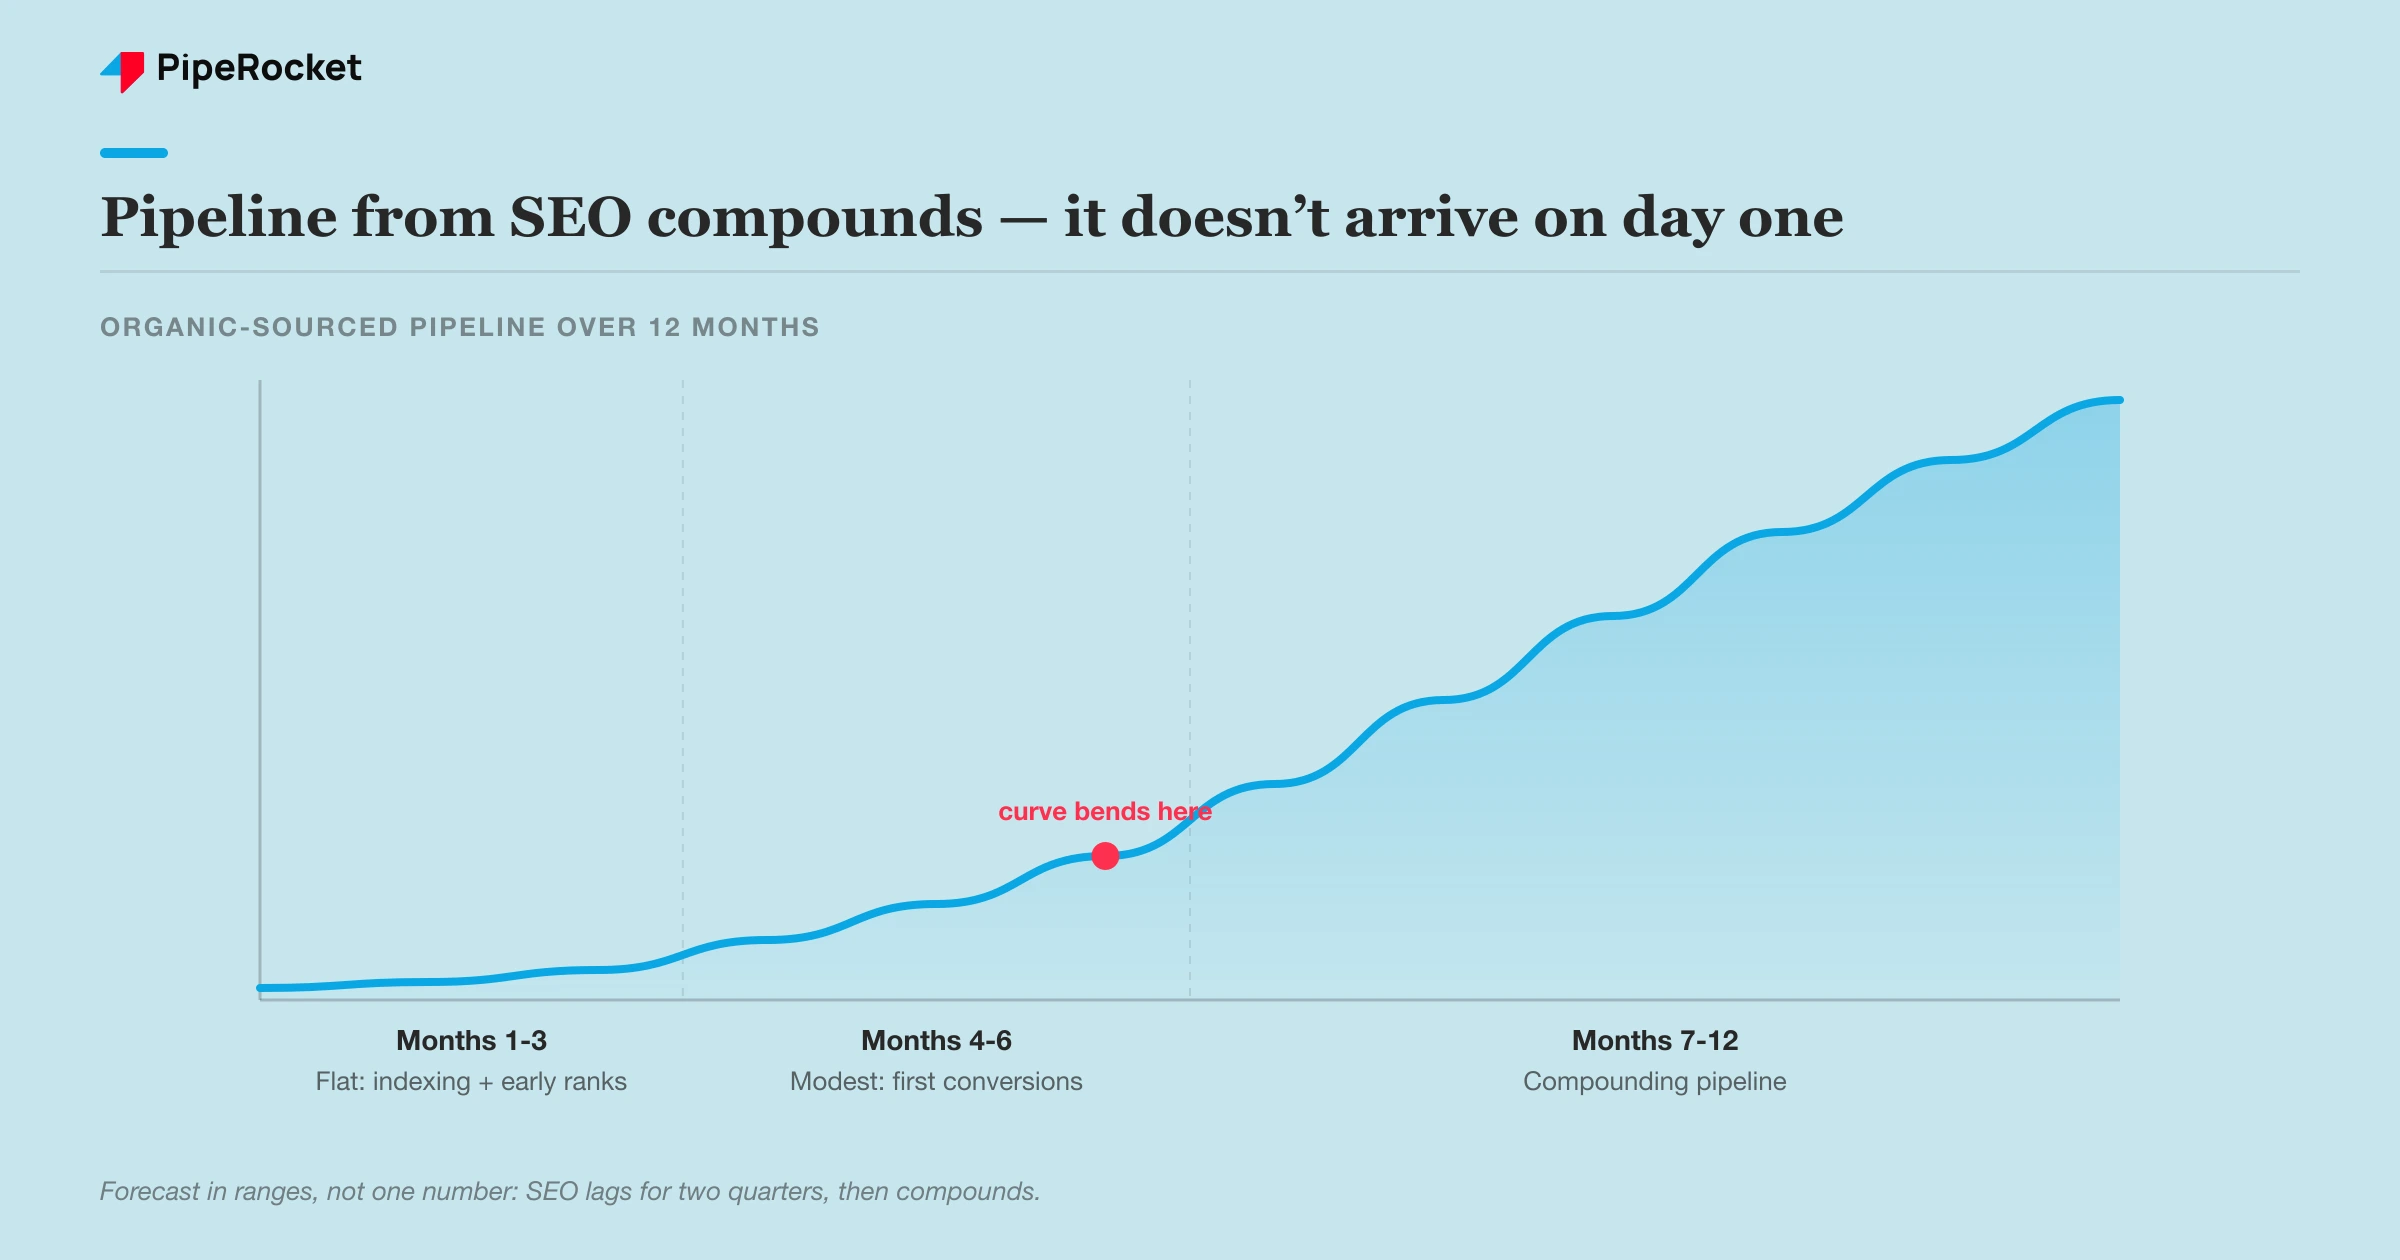
- Phase the timeline because SEO lags then compounds: Front-load almost nothing in the first two quarters and let the curve bend up around month six, or the forecast falls apart on contact with reality.
Why Most SEO Forecasts Fall Apart
Most SEO forecasts fail for one of two reasons, and both are avoidable:
- Built top-down from a target. Leadership says “grow organic pipeline 40%,” and the forecast gets reverse-engineered to land there. That’s not a forecast, it’s a quota with a chart attached.
- Search volume treated as traffic. A keyword with 4,000 monthly searches doesn’t send 4,000 visits; it sends a fraction based on where you rank, and that fraction is brutal below position three. Skip the click curve and you overstate traffic by three to five times before conversion.
The honest version runs the other direction. You start from keywords you can actually rank for, estimate the traffic each could earn, and let the pipeline number fall out the bottom. Sometimes that number is smaller than leadership hoped, which is fine, because a forecast that only ever confirms the target is worthless.
So why does this keep happening on teams that otherwise know their numbers? A forecast feels like it has to be confident, and confidence reads as a single big number. The fix is to make it a visible chain of assumptions where anyone can see which link is doing the heavy lifting.
Step 1: Build the Forecast Bottom-Up From a Keyword List
Start with a list of keywords you have a real shot at ranking for, not your whole category. The forecast is only as honest as the keyword list under it, so this step decides everything downstream.
Pull the keywords you’re targeting over the forecast window and, for each one, note three things:
- Monthly search volume (from Google Keyword Planner, since that’s Google’s own data, not a third party’s modeled estimate)
- The realistic position you expect to reach, given your authority and the competition
- The intent behind it, which sets the conversion rate later
Be ruthless about that middle column. If your domain is mid-authority and a keyword’s first page is wall-to-wall enterprise competitors, you’re not landing position two in nine months. Model position six, or leave the keyword out. We’ve watched plenty of forecasts inflate themselves purely by assuming top-three rankings on terms the site had no business targeting yet.
One nuance most forecasts miss entirely. A single page rarely ranks for one keyword. A well-built post picks up a primary term plus a tail of secondary keywords , and across a content program that secondary traffic compounds hard.
Our team treats secondary keywords as the most underrated lever in SaaS SEO , because one post ranking for twenty terms instead of two does the work of ten articles. Fold a conservative secondary-traffic multiplier into the model rather than pretending each page earns only its primary keyword.
Step 2: Turn Volume Into Traffic With the Click Curve
Apply a click-through rate tied to expected position, because raw search volume is not traffic. This is the single biggest correction between a fantasy forecast and a defensible one.
Click-through rate drops off a cliff as you move down the page. The exact numbers vary by query and SERP layout, especially now that AI Overviews eat into informational clicks, so treat any CTR table as directional. As a working model:
| Expected position | Rough CTR to model | What it means for 4,000 searches |
|---|---|---|
| Position 1 | ~25-30% | ~1,000-1,200 visits |
| Position 2-3 | ~10-15% | ~400-600 visits |
| Position 4-6 | ~4-7% | ~160-280 visits |
| Position 7-10 | ~2-3% | ~80-120 visits |
Run each keyword’s volume through the CTR for the position you modeled in Step 1, not the position you hope for. Then haircut informational queries further if AI Overviews are likely to answer them inside the SERP , because those clicks may never arrive at all.
Here’s the trade-off this exposes. Chasing a few high-volume head terms looks great on a slide and converts terribly, while a stack of lower-volume, high-intent terms looks unimpressive but feeds real pipeline. A forecast built on head-term volume will look bigger and deliver less. Sum the realistic visits across every keyword, and that monthly traffic estimate is what flows into conversion.
Step 3: Convert Traffic to Pipeline by Page Type
Never run one blended conversion rate through the whole forecast. A top-of-funnel blog post and a comparison page do completely different jobs, and a single average will badly misprice both.
The mistake is taking a site-wide “0.9% converts” number and applying it to every keyword’s traffic. That overstates pipeline from your top-of-funnel content , which converts far lower, and understates it from your decision-stage pages, which convert far higher. The forecast ends up directionally wrong in two places at once. Segment by the intent you tagged in Step 1 and convert each bucket on its own rate:
| Page type | Intent | Conversion rate to model | What converts |
|---|---|---|---|
| Comparison / alternative pages | High, near-purchase | ~3-4% | Demo or trial request |
| Product / feature pages | Mid to high | Demo-led, varies | Demo or sales contact |
| Top-of-funnel content | Low, learning | ~0.75% | Asset download, then nurture |
Use your own historical rates if you have them, because these benchmarks are a starting point, not gospel. Then carry each bucket the rest of the way down: apply your real lead-to-opportunity rate and your real close rate to get pipeline and revenue.
If you don’t have clean organic close-rate data yet, that’s the gap to fix before the forecast means anything, since you can’t project pipeline on a channel you can’t attribute to pipeline in the first place.
Take a worked example. A compliance SaaS for fintech teams forecasts 600 monthly visits to a set of comparison pages at a 3.5% demo rate, which is roughly 21 demos a month, then applies its real demo-to-close rate and average deal size to turn that into a pipeline and revenue range. No rankings on the slide, just the funnel.
Step 4: Phase It Over Time, Because SEO Lags Then Compounds
Spread the forecast across the timeline instead of dividing the annual number by twelve. SEO doesn’t pay out evenly, so a flat monthly forecast is wrong in both directions: too optimistic early, too pessimistic late.
New pages take months to get indexed, earn authority, and climb to positions that drive real traffic, and the buyers they reach take more months to convert in a B2B cycle. So the first couple of quarters should forecast almost nothing in pipeline terms.
Then the curve bends. Across the programs we’ve run, the compounding tends to kick in around month six, with clicks climbing month over month from there rather than arriving in a straight line.
Phase it roughly like this:
- Months 1-3: indexing and early ranking movement, near-zero pipeline forecast
- Months 4-6: first meaningful traffic on easier terms, modest pipeline
- Months 7-12: compounding traffic and the bulk of the year’s pipeline
Warning: if your forecast shows steady pipeline from month one, it will blow up the moment leadership compares it to reality in Q1. Under-promise the front half deliberately. The credibility you keep when the slow start matches your forecast is worth more than the bigger number you’d have shown by faking an early ramp.
This is also where you sanity-check the spend behind the forecast. As a working range, SaaS companies tend to put roughly 10-15% of marketing budget into SEO, weighted by stage, with earlier-stage companies often running higher to establish presence. If the pipeline you’re forecasting only pencils out under a budget far above that band, the forecast is telling you the program is mis-scoped, not that the math is wrong.
Step 5: Report It as a Range With Visible Assumptions
Report the forecast as a range, never a single number, and show the assumptions next to it. A point estimate pretends to a precision SEO doesn’t have, and the first time it misses, the whole channel loses credibility.
Build three cases off the same model by flexing the two assumptions that move the result most:
- Conservative: lower expected positions, lower secondary-keyword multiplier, slower ramp
- Base: your honest best estimate on each assumption
- Upside: stronger rankings and faster compounding, clearly labelled as the stretch
Put the conservative number forward as your commitment and the upside as the ceiling, not the plan. Then list the assumptions plainly: expected positions, the CTR model, conversion rates by page type, close rate, and ramp timing. When the real number lands, you can point to exactly which assumption was off, which is how a forecast earns trust over a year instead of losing it in one quarter.
The honest framing to leadership is simple. Here’s what we can defensibly commit to, here’s the upside if rankings come faster, and here’s every lever the number depends on. A finance team trusts that far more than one clean figure with no working shown.
Common Mistakes That Wreck an SEO Forecast
The fastest way to lose trust is a forecast that looks confident and collapses on contact with the first quarter’s data. A few patterns do it every time.
Forecasting Off Search Volume Instead of Clicks
Treating 4,000 monthly searches as 4,000 visits is the most common forecasting error, and it overstates traffic by three to five times before the conversion math even begins. Most searches never turn into a click on your result, and the share that does depends heavily on your ranking position.
Volume only becomes a forecast once it passes through a position-based click-through rate: a number-one ranking might capture a quarter to a third of clicks, while position eight captures low single digits. Forecast the clicks you can realistically win, not the raw demand.
Assuming Top-Three Rankings You Haven’t Earned
A mid-authority site modelling position two on enterprise-dominated keywords is writing fiction, not a forecast. Ranking depends on your domain’s authority relative to the incumbents already holding those spots, and on competitive terms they’re hard to displace quickly. The honest version models the position your authority supports today, keyword by keyword; if that answer is page two, you forecast page-two clicks or drop the term entirely.
Blending One Conversion Rate Across All Page Types
A single site-wide conversion rate misprices everything. It overstates what your top-of-funnel blog content will convert and understates your decision-stage pages, so the forecast is wrong in both directions at once. A pricing or comparison page might convert at a few percent while an awareness blog converts at a fraction of that.
Segmenting fixes it: tag each keyword by intent, give each page type its own conversion rate from your actual data, and convert each bucket on its own number.
Flat Monthly Phasing
Dividing the annual forecast by twelve ignores how SEO actually behaves: it lags for months while content earns its rankings, then compounds once it does. Flat phasing is wrong early, when it promises traffic you haven’t started earning, and wrong late, when it undercounts the compounding. It also sets you up to miss every early month and spook leadership right before the channel turns.
A realistic curve stays low through roughly the first two quarters and ramps around month six, matching how organic actually compounds.
A Single Point Estimate
One confident number with no range and no stated assumptions has nowhere to hide when it misses, and SEO forecasts miss often enough that this matters.
Report a range with three cases instead:
- a conservative case
- a base case
- an upside
Show the working under each: the CTR curve, the conversion rates, the ramp. That keeps the forecast defensible when reality lands inside the range, and it turns a miss into a conversation about which assumption moved rather than a hit to your credibility.
How PipeRocket Builds SEO Forecasts That Hold Up
We don’t hand you a single big number and hope. As a SaaS SEO agency , we build the forecast bottom-up from a real keyword list, run it through a position-based click model, convert by page type on your own rates, and phase it for the lag and the compounding.
You get a conservative-to-upside range with every assumption on the table, so the number survives a board conversation instead of unraveling in Q1. If you want organic forecast as a real pipeline projection, reach out to us and we’ll build it with you.
Frequently Asked Questions
How do you forecast pipeline from SEO?
You build a funnel model from the bottom up.
Start with a list of keywords you can realistically rank for and their search volumes, apply a click-through rate based on the position you expect to reach, then convert that traffic to leads using conversion rates segmented by page type. Finally, apply your real lead-to-opportunity and close rates to get pipeline and revenue, and phase the whole thing over twelve months because SEO lags before it compounds. Report it as a range, not a single number.
Why is forecasting SEO harder than forecasting paid search?
Because paid search buys traffic instantly and SEO earns it slowly.
With paid, you can model spend to clicks to conversions in real time and adjust within days. SEO has a lag of several months between publishing and ranking, and another lag between ranking and the buyer converting, so the forecast depends on assumptions about future positions you don’t control. That uncertainty is exactly why an SEO forecast should be a range with visible assumptions rather than a precise figure.
How long before an SEO forecast starts coming true?
Usually around month six, give or take, depending on your starting authority and how competitive the keywords are.
New content needs time to get indexed, earn links and authority, and climb to positions that drive meaningful traffic, and the buyers it reaches take more months to convert in a B2B SaaS cycle. The first two quarters of any honest forecast should show very little pipeline, with the curve bending up in the second half of the year as the compounding kicks in. Judge the forecast on a trailing six-to-twelve-month basis, not a single month.