SaaS CAC: How to Calculate, Benchmark, and Actually Lower It
 Omar Sheriff
Last updated on
Omar Sheriff
Last updated on
SaaS CAC (Customer Acquisition Cost) is the fully loaded cost of winning one new paying customer: sales and marketing spend, salaries, tools, and ad costs, divided by the number of new customers won in that period.
TL;DR
- SaaS CAC is total sales and marketing cost divided by new customers won, and the number is only honest if every real cost sits in the numerator.
- Most teams undercount the formula by leaving out salaries, tools, and internal hours, which makes CAC look better than it actually is.
- A CAC ratio or LTV:CAC ratio tells you whether that cost is sustainable, and healthy SaaS businesses generally sit above 3:1 on lifetime value to CAC.
- Benchmarks vary hugely by deal size and motion, so the useful comparison is against companies selling the way you sell.
- Median SaaS CAC payback is about 16 months, and anything close to double that is worth a targeting or funnel review before assuming spend is the problem.
- CAC comes down through funnel and targeting fixes first, and cutting spend without fixing the funnel usually just slows growth at the same cost per customer.
- The most common mistakes are measuring CAC too early, blending channels together, and comparing your number to a benchmark that doesn’t match your sales motion.
What Is SaaS CAC?
SaaS CAC is the total, fully loaded cost of acquiring one new paying customer over a set period, covering every sales and marketing dollar spent to win them. It’s the core unit-economics number for any subscription business, because it tells you what growth actually costs on the books.
The number only means something next to two others: how much that customer is worth over their lifetime, and how fast you recover the cost. A $2,000 CAC on a customer worth $6,000 a year is a completely different business than a $2,000 CAC on a customer worth $600 a year, even though the acquisition cost is identical.
That’s why CAC on its own is a half-finished metric. It answers “what did this cost,” but it says nothing about whether the cost was worth paying, which is where the ratio work later in this guide comes in.
How to Calculate SaaS CAC (the Formula)
The SaaS CAC formula is simple: total sales and marketing costs for a period, divided by the number of new customers acquired in that same period. Run it monthly, quarterly, or annually, whichever matches how your finance team already reports.
CAC = Total Sales & Marketing Costs ÷ Number of New Customers Acquired
Say a company spends $80,000 on sales and marketing in a quarter and closes 40 new customers. CAC for that quarter is $2,000. Getting this base formula right is the easy part. What actually belongs in that numerator is where the calculation gets challenged, covered in the next section.
What Should You Include in the CAC Numerator?
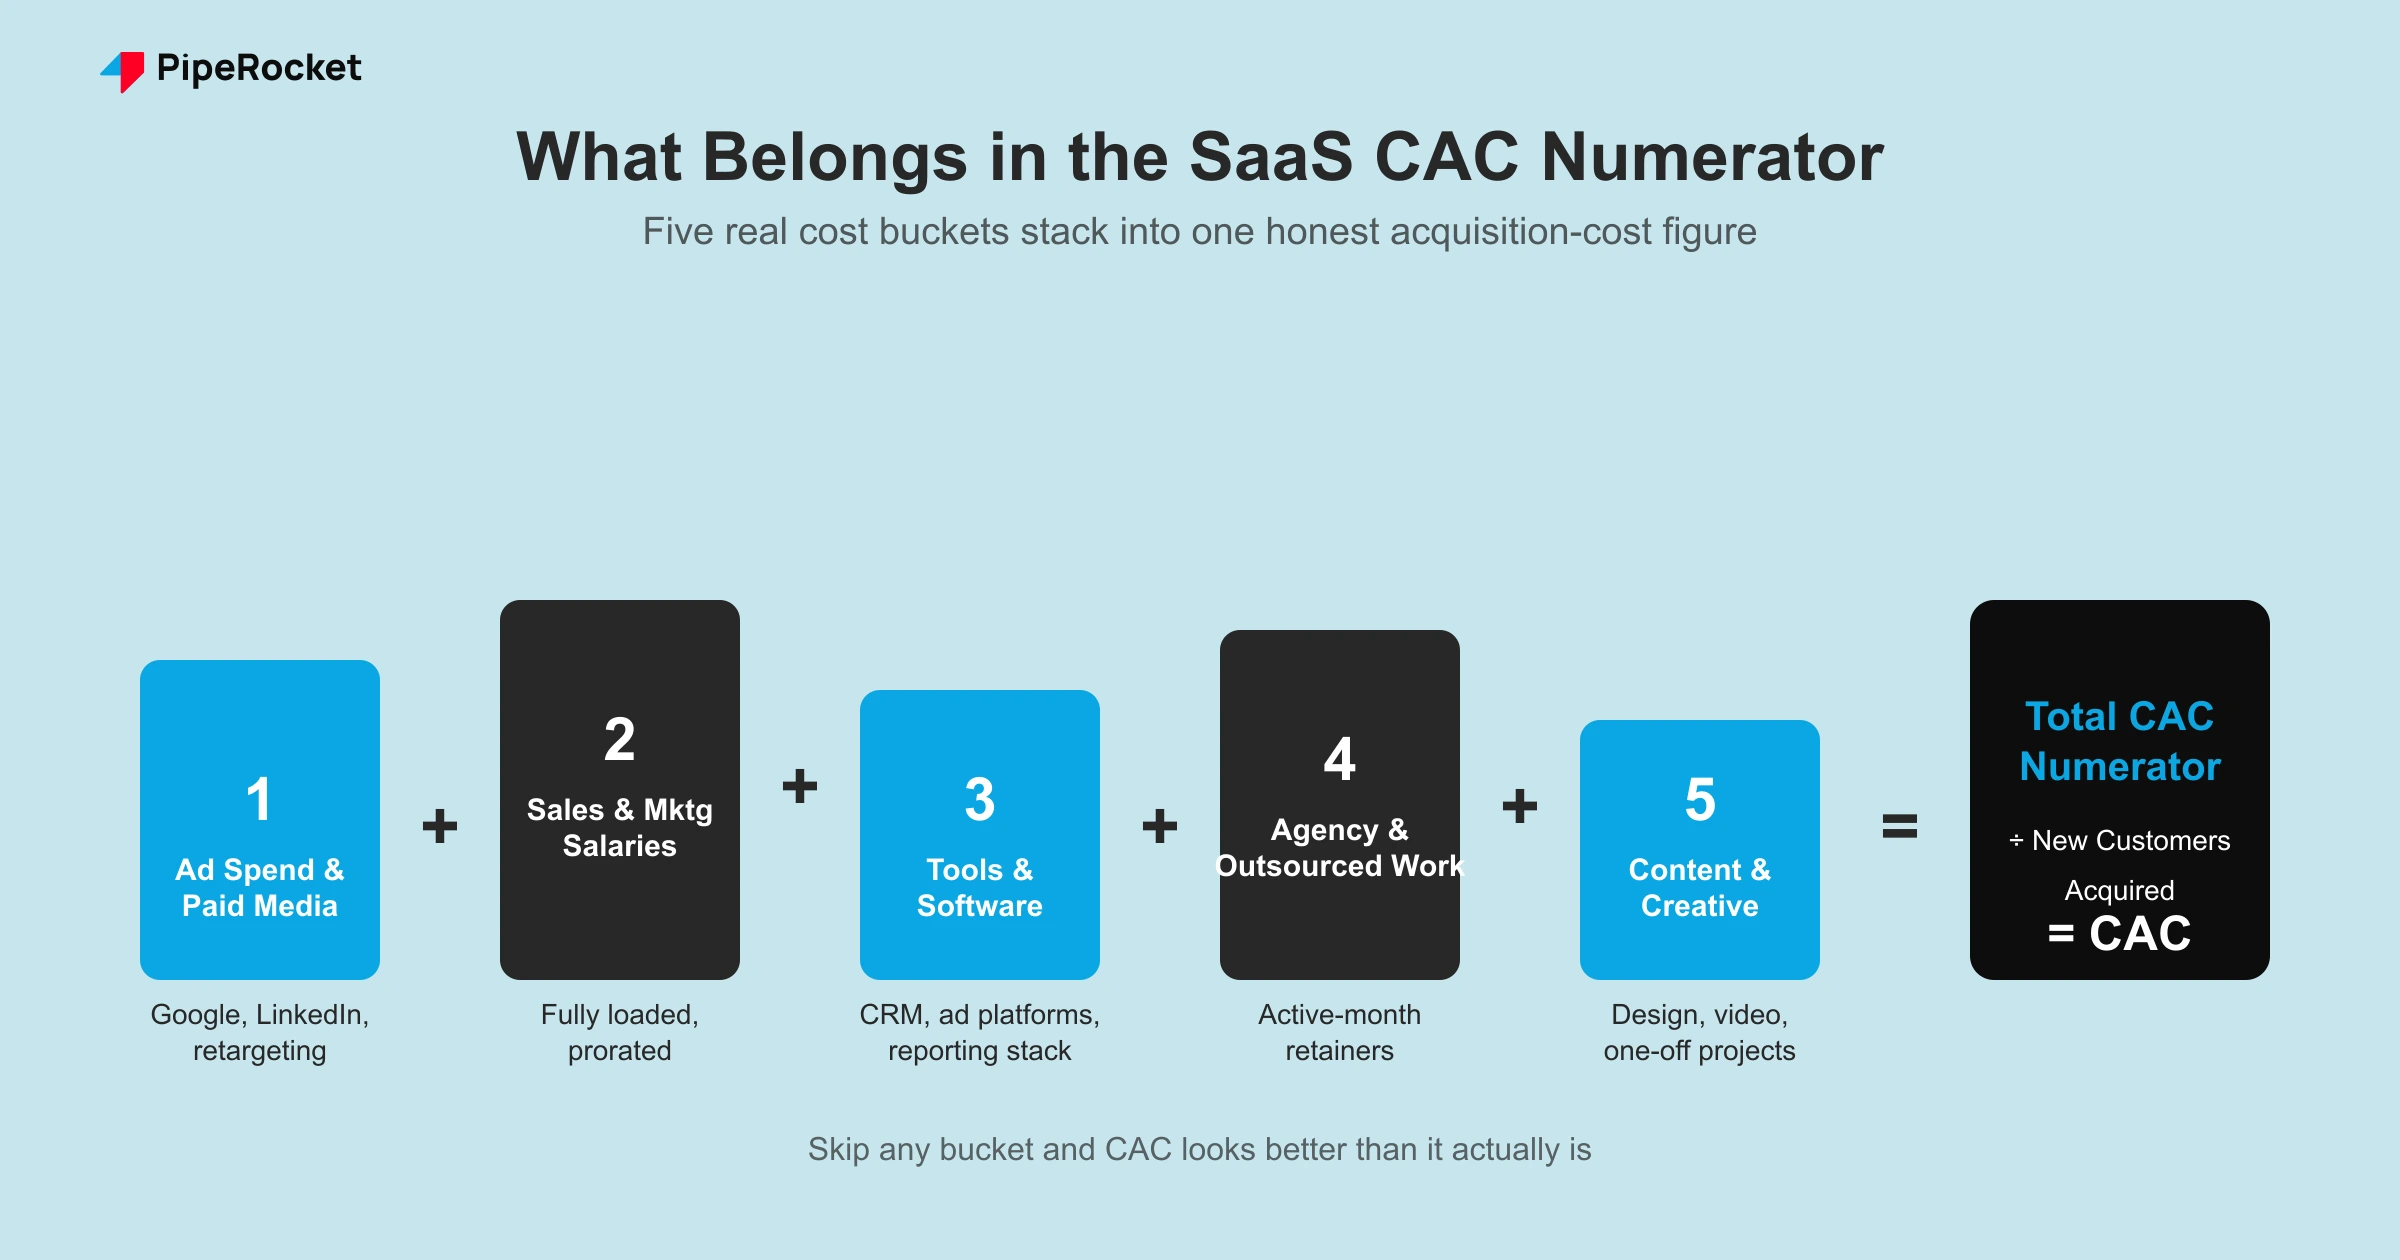
The CAC numerator should include every dollar spent to win new customers, including the costs that are easy to overlook beyond the obvious media spend or single tool subscription. Leaving out real costs is the single biggest reason CAC numbers get challenged by finance later.
Ad spend and paid media
Every dollar spent on paid channels, Google Ads , LinkedIn, display, retargeting, belongs in the numerator for the period it ran in. This part almost never gets missed, because it’s the line item with the clearest invoice attached to it.
Sales and marketing salaries
Fully loaded salaries (base, commissions, benefits, and overhead) for every SDR, AE, and marketer whose job touches new-customer acquisition belong in the cost base. If someone splits their time between acquisition and retention work, prorate it instead of leaving it out entirely.
Tools and software
Rank trackers , ad platforms, a CRM’s acquisition-facing seats, content tools, all of it counts. Across the acquisition work we’ve run for SaaS clients, the tooling line adds up faster than most finance teams expect once you stack a CRM, an ad platform, and a reporting stack together.
Agency fees and outsourced work
Any agency retainer tied to acquisition work (SEO , paid, content, design) goes in the numerator for the months it was active. A common mistake is dropping the agency fee the moment a campaign pauses, even though the cost was incurred to build the pipeline that closed later.
Content and creative production
Design, video, and content production costs for acquisition-facing assets count too, even when they’re one-off projects rather than a recurring line item. A landing page redesign or a video ad shoot is an acquisition cost the same quarter it’s paid for.
Skip any of these and the CAC number looks better than it is, right up until finance rebuilds it with the full cost base and the story changes.
What Is a Good CAC Ratio for SaaS?
A good CAC ratio compares what a customer costs to what they’re worth, and the widely used benchmark is an LTV:CAC ratio of 3:1 or higher. Below that, growth usually isn’t sustainable once the honeymoon funding period ends.
The LTV:CAC ratio divides customer lifetime value (gross-margin revenue expected over the relationship) by CAC. A 3:1 ratio means a customer returns three times what it cost to acquire them, which leaves room for the margin, support, and product costs that come after the sale.
| Ratio | What it means |
|---|---|
| 1:1 | Break-even, unsustainable once outside funding runs out |
| 3:1 | The healthy benchmark most SaaS businesses aim for |
| 4:1 or higher | Very efficient acquisition, or a sign you could invest more in growth |
A 4:1 or higher ratio isn’t always good news on its own. It can just as easily mean the company is under-investing in growth and leaving pipeline on the table instead of spending it to grow faster.
Expansion CAC Ratio: The Expansion CAC Ratio measures the cost of growing revenue inside existing accounts, separate from the New Customer CAC Ratio that covers new logos. Expansion revenue almost always carries a lower cost than net-new acquisition, so tracking the two ratios apart shows where each growth dollar works hardest.
What Is CAC Payback Period?
CAC payback period is the number of months of gross-margin revenue it takes to recover the cost of acquiring a customer, and median SaaS payback sits around 16 months. It’s a cash-flow question the ratio doesn’t answer: it determines how much cash gets tied up funding the next customer.
The 16-month median comes from Benchmarkit’s 2025 B2B SaaS performance data , where the bottom quartile of companies wait two years or longer to recover acquisition cost. Payback is worth anchoring to because it’s less distorted by deal size than a raw CAC dollar figure.
If your payback stretches well past that median, it’s worth asking whether the sales motion matches how the product is priced, before assuming spending efficiency is the whole story. You can run your own numbers through PipeRocket’s free CAC calculator or the CAC payback period calculator to see where your business actually lands.
SaaS CAC Benchmarks by Deal Size and Motion
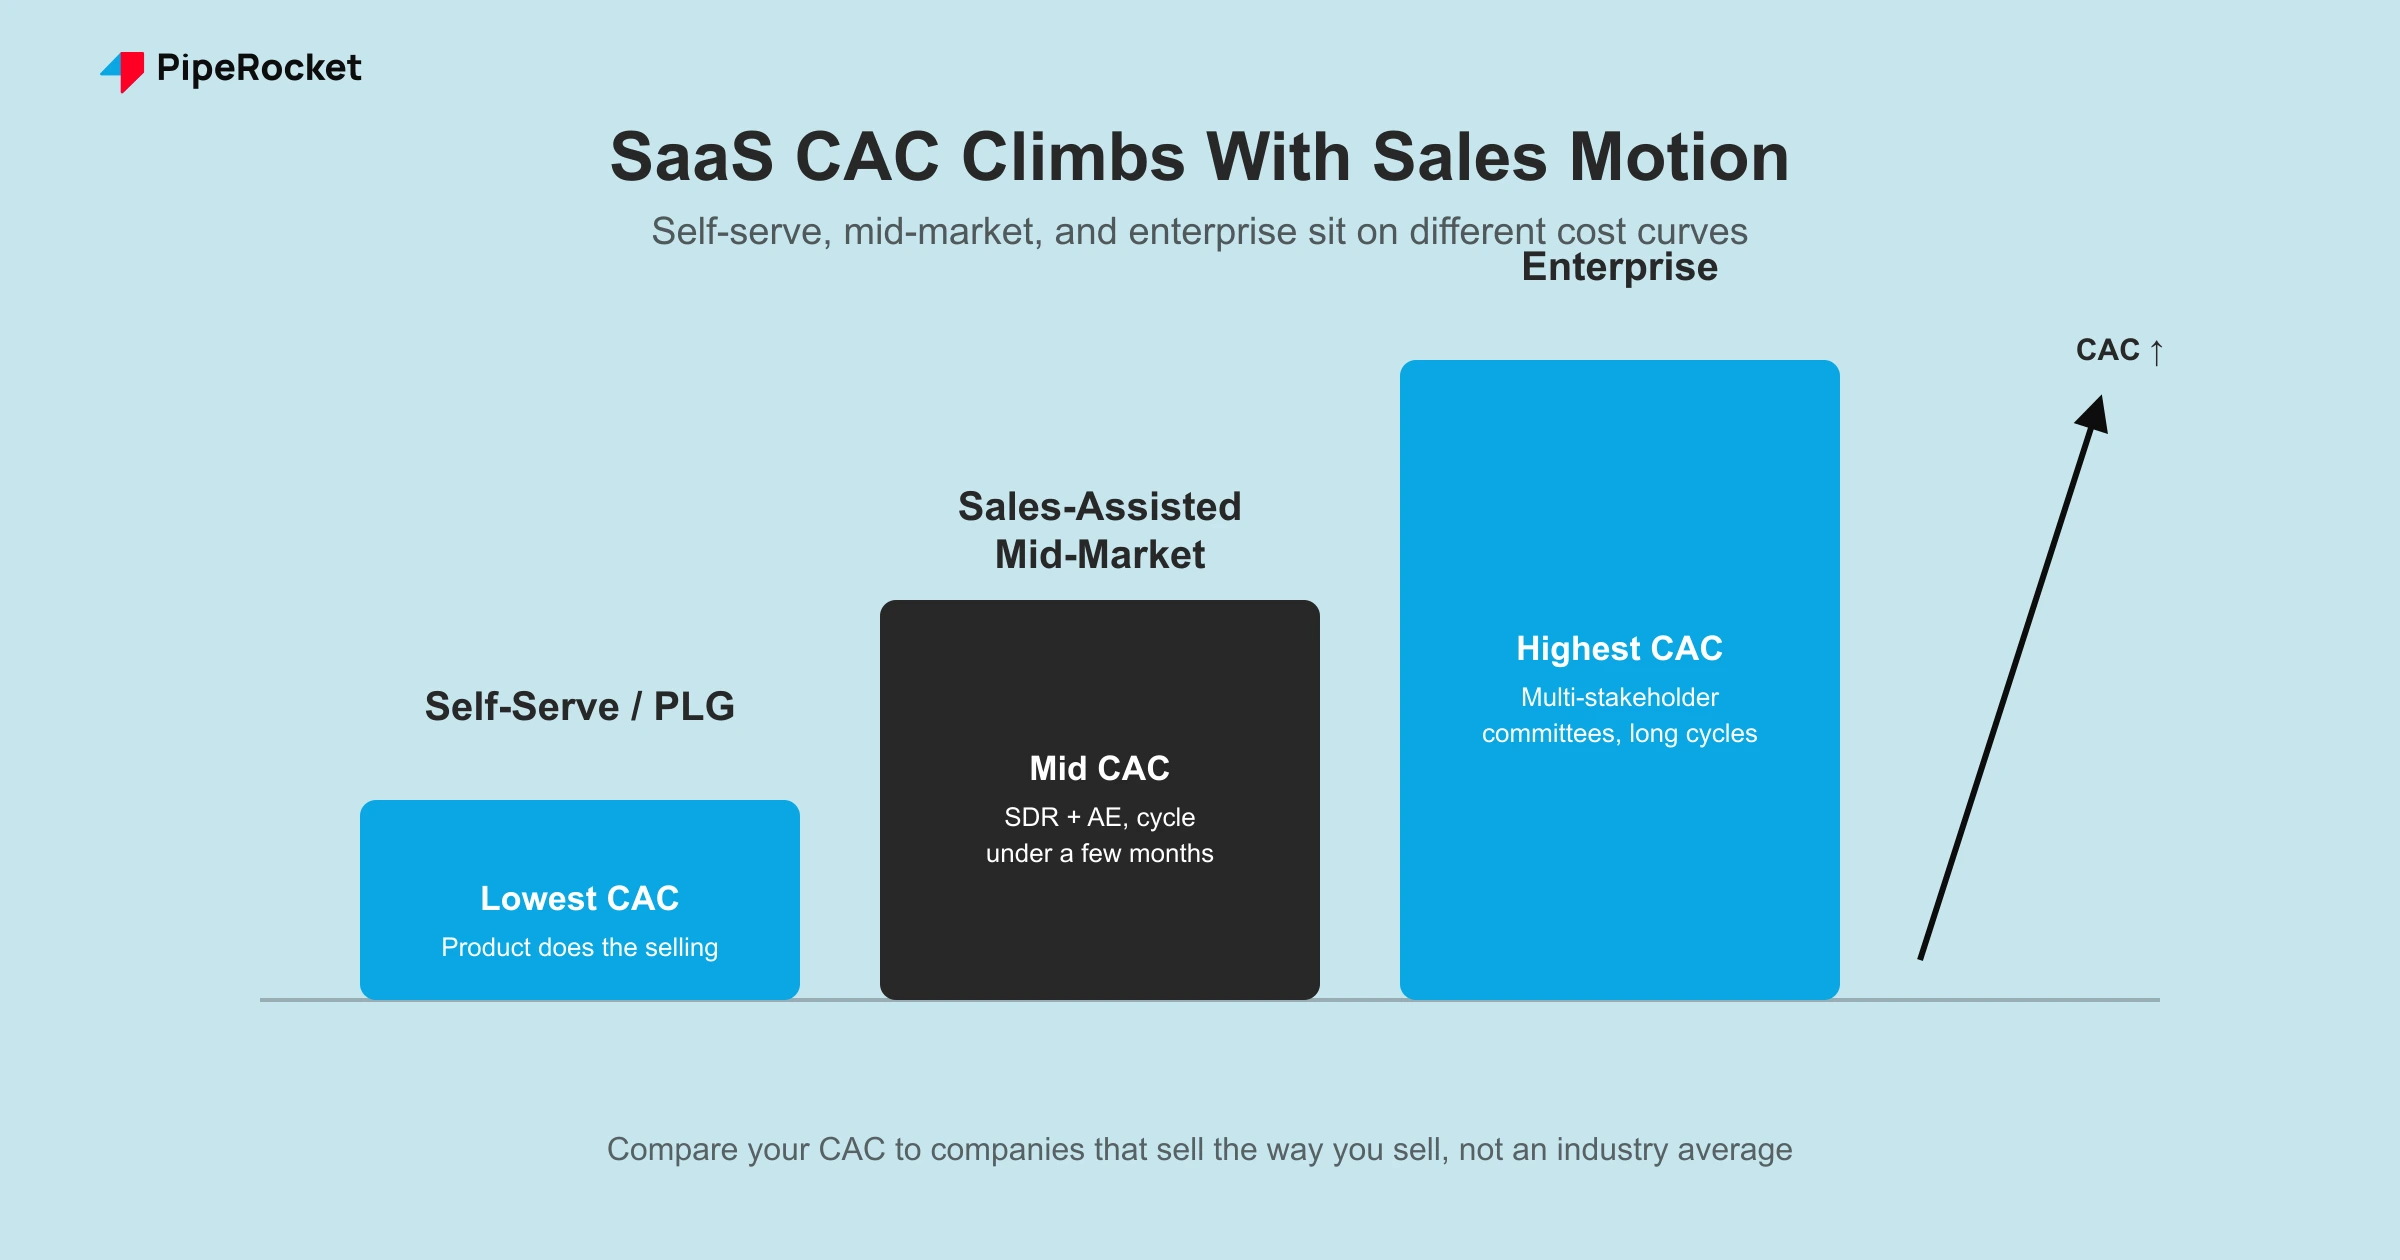
SaaS CAC benchmarks vary so much by deal size and sales motion that a single industry-wide number is close to useless for judging your own performance. A self-serve product with a $50 monthly plan and an enterprise deal at $80,000 a year live on completely different cost curves.
| Sales motion | Typical CAC | Why |
|---|---|---|
| Self-serve / product-led | Lowest | The product does much of the selling, so marketing spend goes further per customer |
| Sales-assisted mid-market | Mid-range | An SDR and AE touch the deal, but the sales cycle stays under a few months |
| Enterprise | Highest | Multi-stakeholder buying committees and long cycles mean more people’s time per closed deal |
CAC has also been trending upward across the industry as a whole. Paddle’s analysis of nearly 700 subscription companies found CAC rose roughly 60% over a five-year window, driven by rising ad costs and more competition for the same buyer attention.
That context matters when a board asks why CAC crept up year over year, because some of that rise reflects broad market pressure rather than your team’s execution.
How to Lower SaaS CAC
Lowering SaaS CAC works best as a funnel and targeting fix first, because cutting budget without fixing what’s underneath it usually just slows growth at the same cost per customer.
Fix targeting before you touch the budget
A campaign spending $30,000 a month to reach the wrong buyer wastes money at any budget level. Before cutting spend, check whether the targeting matches your actual ICP , because a narrower, better-matched audience often lowers CAC faster than a budget cut does.
Shorten the sales cycle with BOFU content
Every extra week a deal spends in the pipeline adds sales and marketing cost without adding revenue. Comparison pages , pricing pages, and case studies built for the exact objections your sales team hears every week shorten that cycle and pull CAC down with it.
Increase trial-to-paid or demo-to-close conversion
If a channel brings in the right leads but they don’t convert, the fix sits deeper in the funnel than the acquisition channel itself. Raising trial-to-paid or demo-to-close conversion rate lowers CAC without spending an extra dollar on acquisition, because the same spend now produces more customers.
Lean on retention and expansion instead of pure new-logo growth
Not every growth dollar has to chase a brand-new customer. Expansion revenue from existing accounts carries a much lower cost than acquiring someone new from scratch, which is why healthy SaaS businesses lean on both instead of funding growth entirely through new-logo spend.
Segment CAC by channel before deciding what to cut
Blended CAC across every channel hides which one is actually working. Split CAC by channel first, because the fix is almost always to shift budget toward the cheaper channel rather than cut the whole budget evenly. Isolating organic CAC in particular tells you the real acquisition cost of your content and search efforts, which a blended number tends to flatter or hide entirely.
Common Mistakes to Avoid When Calculating SaaS CAC
Measuring CAC too early in a customer’s lifecycle
CAC calculated the same month a customer signs looks artificially high, because acquisition costs are usually front-loaded and revenue recognition lags behind. Measure over a trailing period, at minimum a quarter, so the number reflects the real relationship between spend and customers won rather than one noisy month.
Blending every channel into one CAC number
A single blended CAC hides which channel is actually efficient and which one is quietly burning budget. Split CAC by channel so a cheap organic customer and an expensive paid one don’t get averaged into one number that tells you nothing about where to spend next.
Comparing your CAC to the wrong benchmark
An enterprise sales motion and a self-serve product shouldn’t be judged against the same CAC benchmark, because the cost structures aren’t comparable. Compare your CAC ratio and payback period against companies with a similar deal size and motion, since an industry-wide average just blends very different businesses into one meaningless figure.
Leaving real costs out of the numerator
Skipping salaries, tools, or agency fees because they’re harder to attribute makes CAC look better than reality. If finance rebuilds the number later with the full cost base included, the trust gap that creates is worse than reporting an honest, higher number from the start.
How PipeRocket Helps SaaS Teams Lower CAC
We build acquisition programs around CAC and payback economics, the numbers that decide whether growth is actually affordable. If your CAC keeps climbing and no one can say exactly why, our SaaS PPC team can rebuild your channel mix around what’s actually converting.
Our SaaS SEO agency work compounds organic customers at a fraction of the cost paid channels carry long term. If you want a second set of eyes on your acquisition economics, get in touch and we’ll walk through where your CAC is actually leaking.
Frequently Asked Questions
What is SaaS CAC?
SaaS CAC refers to the total cost, fully loaded across salaries, tools, ad spend, and agency fees, that a subscription business spends to win one new paying customer in a given period. It’s calculated by dividing total sales and marketing costs by the number of new customers acquired over the same period. On its own it tells you what growth costs, and it needs to be read against lifetime value and payback period to know whether that cost is sustainable.
What is the SaaS CAC ratio formula?
The CAC ratio, most often expressed as LTV:CAC, divides customer lifetime value by CAC. A 3:1 ratio or higher is the standard benchmark for a healthy SaaS business.
What is CAC payback period?
CAC payback period is the number of months it takes to recover a customer’s acquisition cost from the gross-margin revenue they generate. It’s a cash-flow metric, separate from the CAC ratio, because it tells you how long cash stays tied up before a new customer starts contributing net cash back to the business. Median payback across B2B SaaS sits around 16 months, though it varies widely by deal size, pricing, and sales motion.
Why does SaaS CAC keep increasing?
SaaS CAC has been rising industry-wide because ad costs keep climbing and more companies are competing for the same buyer attention across the same channels. Paddle’s analysis of nearly 700 subscription companies found CAC rose roughly 60% over a five-year window. Rising CAC isn’t always a sign of poor execution. Segment your own CAC by channel before assuming the whole acquisition program is broken, since some of the increase reflects market-wide cost pressure rather than anything specific to your funnel.