150+ Advertising Statistics (Updated October 2026)
 Praveen Ravi
Last updated on
Praveen Ravi
Last updated on
Global ad spend will cross $1 trillion in 2026 for the first time, and for the first time ever, Meta is projected to out-earn Google in worldwide digital ad revenue. Those two headlines alone tell you the ad market is being reshaped from two directions at once: platform competition on one side, and AI reshaping how ads get bought, built, and clicked on the other.
We pulled the most recent, named industry research on advertising, from eMarketer, WARC, IAB, GroupM, and platform earnings reports themselves, and combined it with our own first-party Google Ads data across 65+ B2B SaaS accounts we manage. Every stat below is sourced and dated. Where sources disagree, we say so instead of picking whichever number sounds cleanest.
Key Takeaways
- Global ad spend is projected to reach $1.17 trillion in 2026 per eMarketer, though WARC’s own 2026 forecast puts the figure at $1.30 trillion, a reminder that “total market size” is a modeled estimate, not a hard count.
- Meta is forecast to overtake Google in global digital ad revenue for the first time in 2026: $243.46B versus $239.54B.
- US digital video ad spend will surpass $80 billion in 2026, growing nearly 20% faster than the overall ad market.
- 31.5% of internet users now use an ad blocker at least sometimes, an estimated 912 million people worldwide.
- 83% of ad executives had deployed AI in the creative process by 2026, up from 60% in 2024.
- Google’s AI Overviews cut paid click-through rate by roughly 68% on queries where they appear, but brands cited inside the AI Overview see 91% more paid clicks than uncited competitors on the same page.
- The widely repeated claim that people see “4,000 to 10,000 ads a day” has no traceable primary source. We could not verify it anywhere, and we are not repeating it here.
- For B2B SaaS specifically, the average Google Ads account spends $6.81 per click and $84 per lead, and got more efficient this year while the broader ad market’s costs climbed.
- ROAS benchmarks vary by as much as 60x across industries on the same platform, which makes a single “good ROAS” number close to meaningless without a same-vertical comparison.
Global and US Ad Spend Market Size
Total market size is the stat everyone quotes and almost nobody agrees on. Three of the industry’s biggest forecasters published 2026 numbers that disagree by more than 10%.
- eMarketer projects global ad spending will reach $1.17 trillion in 2026, with the US accounting for 40.7% of worldwide media ad spend. (eMarketer, 2026 )
- WARC Media forecasts global ad spend of $1.30 trillion in 2026 (+9.1%), rising to $1.40 trillion by 2027, with US ad spend reaching $421.1 billion in 2025 alone. (WARC Media, December 2025 )
- Magna Global projects total global advertising will cross $1 trillion for the first time in 2026. (Magna Global, 2026 )
- GroupM projects global digital advertising spend at $835.82 billion in 2026, equal to 68.7% of all global advertising. (GroupM, 2026 )
- US total ad spending is approaching the half-trillion-dollar mark, with traditional TV still drawing over $50 billion in US ad spend in 2026. (eMarketer, April 2026 )
Our take: eMarketer, WARC, and Magna all published a “2026 global ad spend” number this year, and they disagree by roughly $130 billion. That’s not a rounding error. Different firms count media owner revenue, advertiser spend, and currency assumptions differently, so treat any single “global ad spend” headline as directional, not exact, and always check which methodology sits behind it before you build a budget narrative around it.
Ad Spend by Channel
- US digital video ad spend is projected to surpass $80 billion in 2026 ($81.9B), up 11% year over year, nearly 20% faster than the total ad market, and will exceed 60% of total TV/video ad spend for the first time. (IAB, May 2026 )
- Within digital video, social video is projected at $31.9 billion (+13% YoY), overtaking CTV’s growth rate of 11% YoY for the first time. (IAB, May 2026 )
- IAB’s 2026 forecast shows social advertising growing fastest at +14.6% year over year, with CTV close behind at +13.8%. (IAB, 2026 )
- US retail media ad spending is forecast to reach nearly $70 billion in 2026. (eMarketer, 2026 )
- Global retail media now accounts for nearly 14.7% of global ad spend. (WARC Media, December 2025 )
- US out-of-home advertising revenue reached a record $9.46 billion in 2025, up 3.6% year over year, extending the industry’s growth streak to 19 consecutive quarters. Digital out-of-home made up 36.3% of that total, growing 10.5% year over year. (OAAA, March 2026 )
- US digital audio advertising reached $8.4 billion in 2025, up 10.2% year over year, with podcast advertising accounting for $2.9 billion of that, up 17.6% year over year. (IAB Internet Advertising Revenue Report, 2026 )
Our take: social video overtaking CTV’s growth rate is the real headline buried in the video numbers. Most budget conversations still default to “put video dollars into CTV,” but the growth curve says social video is where the incremental dollar is actually working harder right now.
Ad Spend by Platform
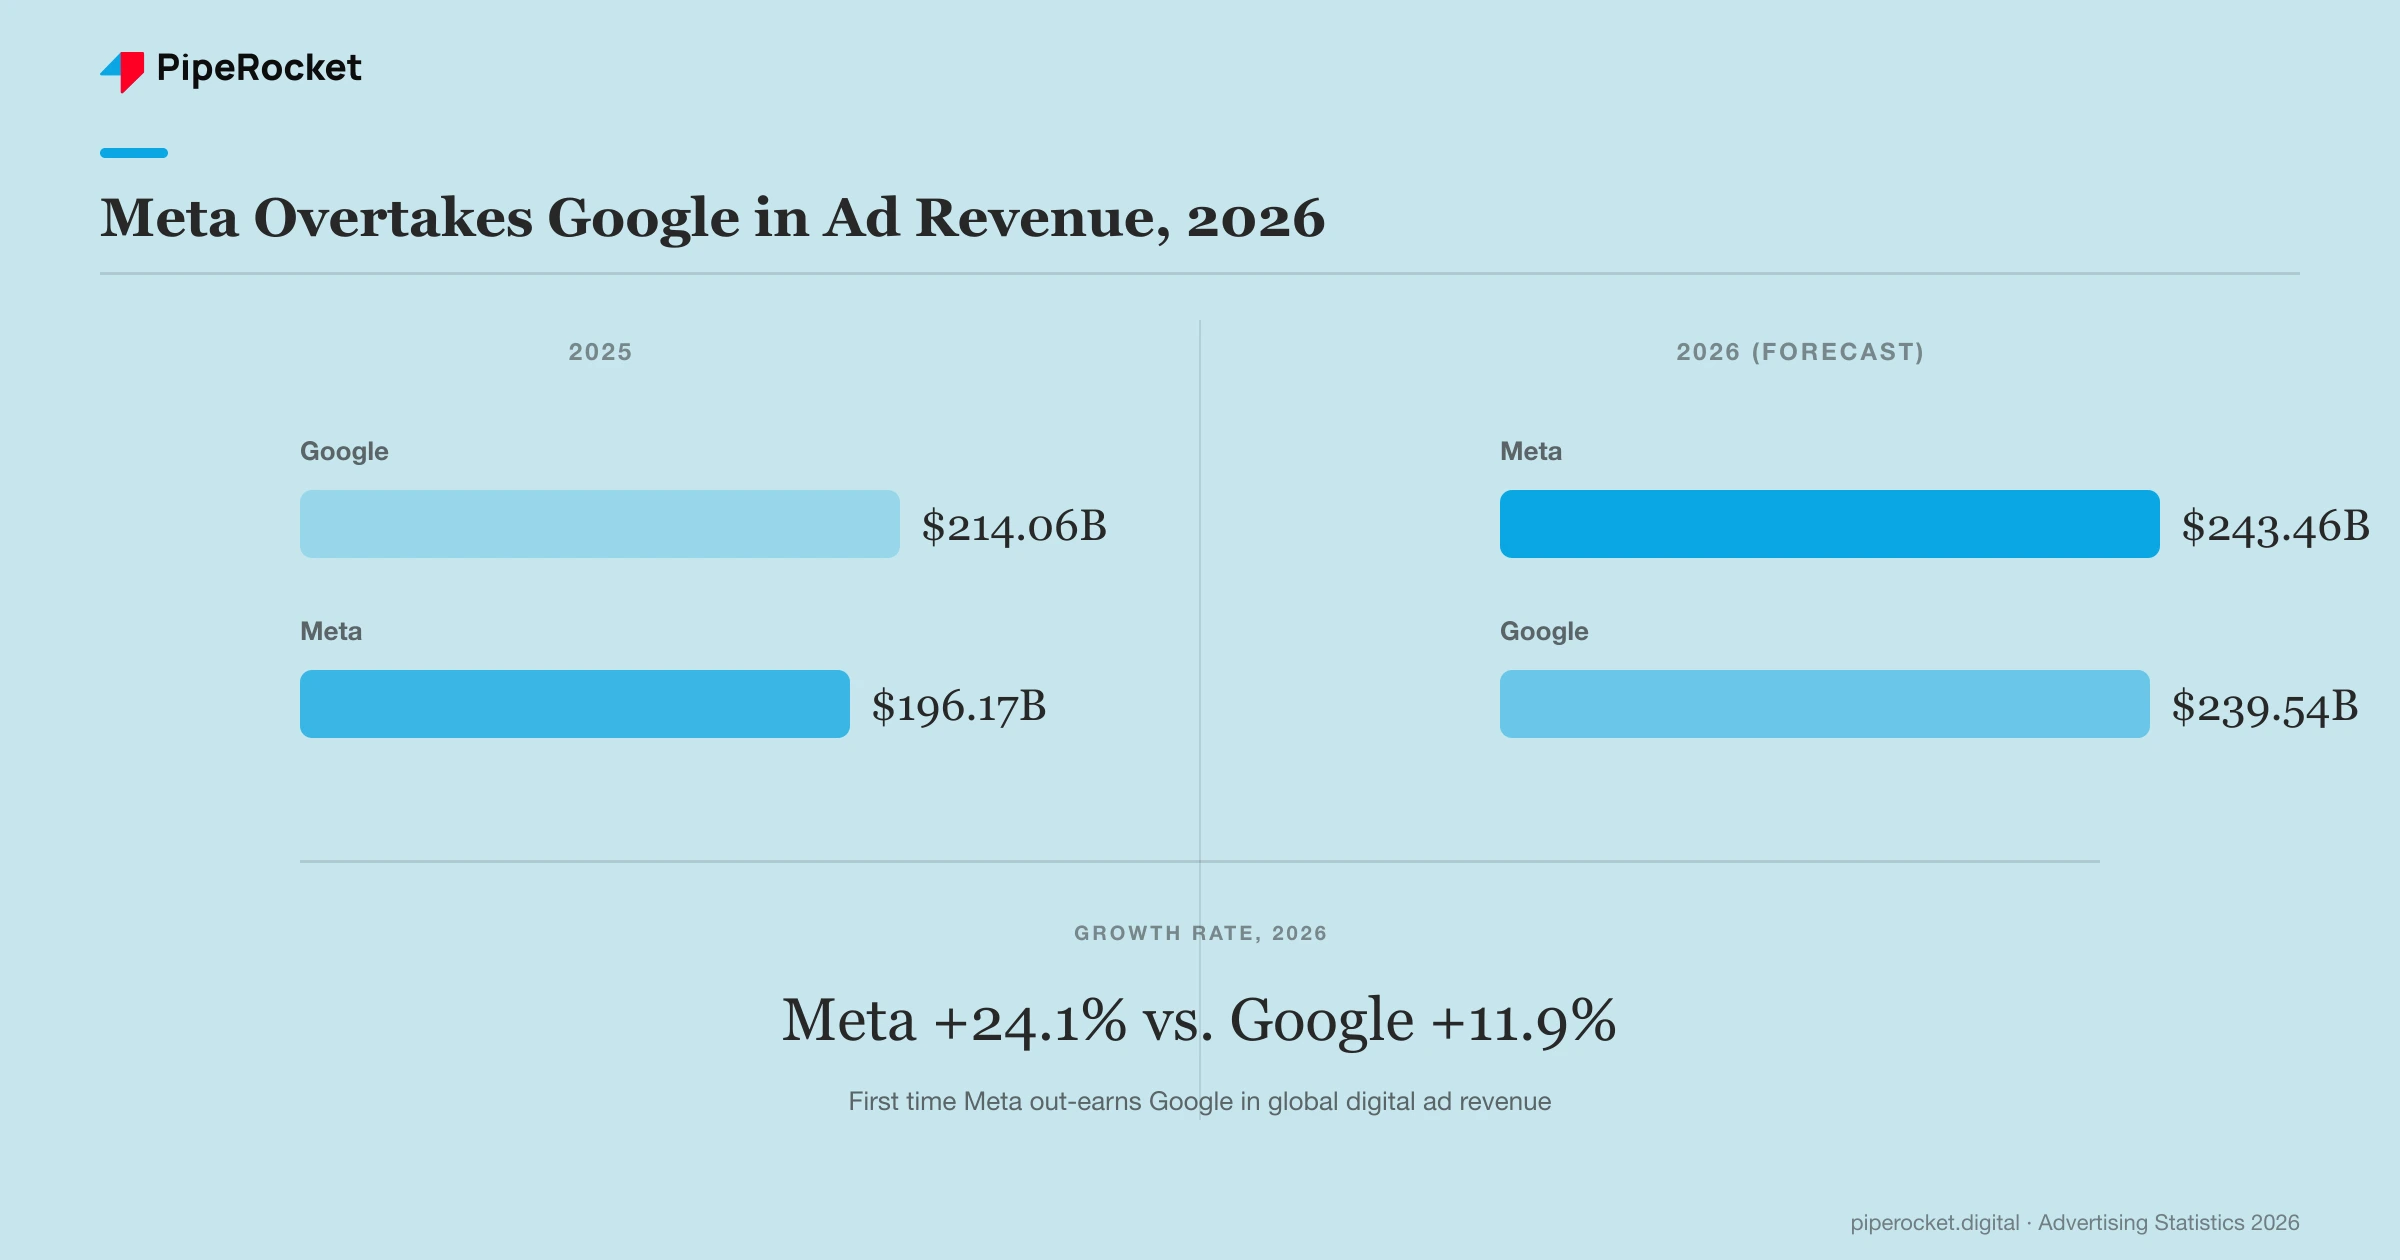
- Meta is forecast to overtake Google in global net digital ad revenue for the first time in 2026: Meta $243.46B versus Google $239.54B, up from Google $214.06B versus Meta $196.17B in 2025. Meta’s 2026 growth rate is accelerating to 24.1%, while Google’s sits at 11.9%. (eMarketer, April 2026 )
- Amazon’s global ad revenue is projected to grow from $68.64B in 2025 to $82.07B in 2026, pushing its share of global digital ad spend to 9.0%. (eMarketer, April 2026 )
- Google, Meta, and Amazon together will represent 62.3% of total worldwide digital ad spending in 2026. (eMarketer, April 2026 )
- Alphabet’s advertising revenue reached $82.28 billion in Q4 2025, up 13.5% year over year, with total Q4 2025 revenue at $113.8 billion, up 18% year over year. (Alphabet Q4 2025 earnings, February 2026 )
- Alphabet’s Q2 2026 advertising revenue reached $81.6 billion, up 14.5% year over year, with Google Search advertising alone at $63.3 billion, up 17% year over year. (Alphabet Q2 2026 earnings, July 2026 )
- Meta’s Q4 2025 advertising revenue reached $58.1 billion, up 24% year over year, with average price per ad up 6% and ad impressions up 18% over the same period. (Meta Q4 2025 earnings, January 2026 )
- More than half of all Instagram ads ran in Reels in 2025, up from 35% in 2024, with Reels reaching an annual run rate over $50 billion. (Meta Q3 2025 earnings coverage, January 2026 )
- Amazon’s Q4 2025 advertising revenue reached $21.3 billion, up 22% year over year, with full-year 2025 ad revenue surpassing $68 billion. (Marketing Dive, early 2026 )
- Microsoft’s LinkedIn revenue rose 11% year over year to $5.08 billion in the quarter ended December 31, 2025, the first time LinkedIn topped $5 billion in quarterly revenue, driven largely by LinkedIn Marketing Solutions. (GeekWire, early 2026 )
Our take: the “Google versus Meta” ad-revenue race gets more interesting once you factor in what’s happening to Google’s own click-through rates. Its search ad revenue is still growing, but its AI Overviews are actively suppressing the paid clicks that revenue depends on (more on that below). Google is being squeezed by a rival platform on one side and by its own AI product on the other.
Programmatic Advertising
- Programmatic buying accounts for an estimated 83.2% of global digital ad spending, and roughly 91.5% of global digital display ad spend specifically. (Industry compilation, 2026 )
- US programmatic digital display ad spending is expected to exceed $220 billion in 2026, up 17.4% year over year. (Industry forecast compilation, 2026 )
- Global programmatic advertising spending is projected to exceed $725 billion by 2026. (Industry forecast compilation, 2026 )
Our take: programmatic’s headline percentages get repeated everywhere, but almost none of the roundups quoting them cite a single, dated primary report. Treat the 80 to 90 percent range as directionally right, not as a precise figure you’d want to put in a board deck without your own source check.
Consumer Ad Exposure, Ad Blocking, and Ad Fatigue
- 31.5% of internet users aged 16 to 64 use an ad blocker at least sometimes, an estimated 912 million people worldwide. In 28 of 53 countries studied, ad blocker use exceeds 30%. (GWI data via Backlinko, 2026 )
- Ad blockers are most popular among men aged 25 to 34 at 34.5% usage, versus 31.6% for women in the same age group. The top reasons cited are too many ads (63.5%), obstructive ad formats (53.5%), and privacy concerns (42.4%). (GWI data via Backlinko, 2026 )
- 67% of consumers report “banner blindness,” subconsciously ignoring anything that visually resembles an ad. (Industry consumer survey compilation, 2026 )
Our take: the “average person sees 4,000 to 10,000 ads a day” claim shows up in almost every advertising statistics roundup online, usually credited vaguely to “eMarketer” or “the American Marketing Association.” We looked for the original study behind it and couldn’t find one. Every trail led back to other listicles quoting each other, with the number itself drifting between 4,000 and 10,000 depending on which page you land on. We’re not repeating it here, and we’d treat any competitor page that states it as a hard number with real skepticism.
B2B Advertising Benchmarks
- Average LinkedIn Ads CPC sits around $5.26, ranging from $5.50 to $8.50 depending on format and audience, with Technology and Finance carrying a $9 to $14 premium per click. Average CTR runs around 0.44%, with video ads performing highest at 0.55% to 0.70%. (Industry LinkedIn Ads benchmark compilation, 2026 )
- Cross-industry LinkedIn Lead Gen Form conversion rate rose 0.31 percentage points year over year to 6.1%, while cross-industry CPC rose 9%, the steepest annual CPC increase on LinkedIn since 2022. (Industry LinkedIn Ads benchmark compilation, 2026 )
- A typical LinkedIn-influenced B2B deal involves roughly 88 touchpoints, 4 channels, 10 stakeholders, and a 272 to 320 day cycle. LinkedIn-attributed ROAS improved from 113% to 121% over the same measurement period. (Dreamdata B2B attribution data, 2026 )
- Demand Gen Report’s own 2026 ABM benchmark survey found 52% of B2B marketers say their ABM program is meeting expectations, with another 23% saying it’s exceeding expectations. 47% named personalized content the tactic delivering the highest ROI among all ABM tactics measured. (Demand Gen Report, May 2026 )
Our take: B2B advertising is the category with the thinnest real data behind it. Every consumer-platform ad-spend number above traces to a named analyst firm or a company’s own earnings release. LinkedIn’s own CPC and CTR benchmarks, by contrast, trace only to secondary compilers repeating each other, not to LinkedIn’s own published numbers.
Advertising Statistics for SaaS Companies
Blended cross-industry benchmarks don’t tell a SaaS company much, since SaaS advertising runs on longer cycles and narrower keyword pools than the retail and consumer categories that dominate the numbers above. Here’s what advertising actually costs for B2B SaaS, from our own trailing-12-month analysis of 65+ SaaS accounts we manage. (PipeRocket Digital, Google Ads Benchmarks, October 2026 )
- The average B2B SaaS Google Ads account spends $6.81 per click and $84 per lead, blended across brand and non-brand search.
- Brand advertising costs SaaS companies a fraction of non-brand: $3.12 CPC and $34 per lead for brand terms, versus $13.75 CPC and $207 per lead for non-brand.
- Technical SaaS advertisers (dev tools, security) pay $855 per lead, close to 7x the $126 that GTM and martech SaaS companies pay for the same channel.
- SaaS advertising got more efficient year over year, with conversion rate up roughly 48% while CPC held flat, a very different pattern from the broader ad market’s rising costs.
Our take: the industry-wide numbers earlier in this report show advertising costs climbing across most channels and platforms. SaaS advertising moved the opposite way on efficiency this year, driven by conversion-rate gains rather than cheaper clicks. If your SaaS account’s CPC feels flat while performance improves, that tracks with the broader SaaS pattern, not an anomaly in your account.
AI’s Growing Role in Advertising
- 83% of ad executives had deployed AI in the creative process by 2026, up from 60% in 2024. More broadly, 87% of marketers use generative AI in at least one workflow, up from 51% in 2024. (Industry AI-in-advertising compilation, 2026 )
- 21% of digital video buyers are already live with agentic AI, 20% are testing it, 25% plan to activate it in 2026, and 28% are actively investigating it. (IAB, May 2026 )
- 80% of marketers use AI for content creation, and 75% use it for media production, per HubSpot’s 2026 State of Marketing report. Marketing leaders at HubSpot describe the resulting output bluntly: more content is now generated by AI than by humans, but it’s mostly average. (HubSpot, 2026 )
- 64% of advertisers now cite cost efficiency as the top benefit of AI, up from fifth place in 2024. (Industry AI-advertising compilation, 2026 )
Our take: the IAB’s own agentic AI figures are the most solidly sourced AI-adoption stat in this whole space, and they show adoption is still early: only 21% of digital video buyers are actually live with agentic AI, not the “everyone’s already doing this” picture some vendor content implies. If your team hasn’t started yet, you’re behind the 21% who are live, but you’re not behind the market.
How Google’s AI Overviews Are Changing Paid Search
- Paid click-through rate on queries where an AI Overview appears crashed 68%, from 19.70% in June 2024 to 6.34% in September 2025, across a study spanning 3,119 informational queries and 42 client accounts. Organic CTR on the same query set fell 61% over the same window. (Seer Interactive, November 2025 )
- Brands cited inside an AI Overview earn 91% more paid clicks and 35% more organic clicks than non-cited brands appearing on the same search results page. (Seer Interactive, November 2025 )
- In Q3 2025, paid CTR measured 13.88% on searches with no AI Overview, 7.89% when the advertiser’s brand was cited inside the AI Overview, and only 4.14% when an AI Overview appeared without citing the brand at all. (Seer Interactive, November 2025 )
Our take: this is the single most useful, least reported finding in this whole research pass. The story most advertisers tell themselves is “AI Overviews are killing paid search.” The real story is narrower and more useful: AI Overviews are killing paid search specifically for brands that don’t get cited inside them. Getting cited is turning into a new, real form of pay-to-play visibility, and it rewards the same off-site authority and structured content work that wins organic AI citations over a bigger ad budget.
ROAS Benchmarks by Platform and Industry
- Median ROAS by platform runs roughly 3.3x to 3.7x on Google Ads , 1.86x to 2.2x on Meta, and around 1.4x on TikTok, with the average across roughly 28 tracked industries sitting near 2.87:1, down about 10% year over year. (Industry ROAS benchmark compilation, 2026 )
- Google Ads ROAS spread is extreme by industry: hotels average around 15.19x, while financial services average just 0.24x on the same platform. (Industry ROAS benchmark compilation, 2026 )
- Cross-industry Google Ads averages sit at 6.64% CTR and $5.42 CPC, more than double the $2.32 CPC of a decade earlier. CPC by industry ranges from $1.63 (Arts & Entertainment) to $9.87 (Attorneys & Legal Services). (WordStream, 2026 )
Our take: a 60x spread in “good ROAS ” between hotels and financial services on the exact same platform means a generic “aim for 3 to 4x ROAS” benchmark is close to useless without a same-industry comparison. If you want benchmarks specific to B2B SaaS rather than a blended average across every industry from hotels to legal services, our Google Ads benchmarks report breaks down CPC, CTR, and cost per lead from 65+ SaaS accounts we manage directly.
What This Means for Your Advertising Strategy in 2026
- Don’t anchor budget decisions to a single “total market size” number. eMarketer, WARC, and Magna disagree by over $100 billion on the same year’s global ad spend. Pick a source, note its methodology, and stay consistent quarter to quarter rather than switching sources when a bigger number is convenient.
- Treat AI Overview visibility as a paid-search lever, on top of an organic one. Brands cited inside an AI Overview get meaningfully more paid clicks too. The off-site authority work that earns AI citations now protects your paid CTR as well.
- Verify B2B and platform-specific benchmarks before you commit to them. LinkedIn CPC ranges, ABM budget-share stats, and most “B2B SaaS Google Ads benchmark” figures online trace back to secondary compilers rather than primary data. Where you can, use benchmarks built from your own vertical.
- Be skeptical of round, dramatic consumer-behavior numbers. The “4,000 to 10,000 ads a day” claim has no verifiable source we could find. If a stat can’t be traced to a dated, named study, don’t build a strategy around it.
If you want benchmarks built from real B2B SaaS accounts instead of blended industry averages, our Google Ads benchmarks and SaaS PPC team can show you where your own numbers stand. Talk to us .