150+ B2B Marketing Statistics (Updated October 2026)
 Kamaraj Mathiarasan (Kim)
Last updated on
Kamaraj Mathiarasan (Kim)
Last updated on
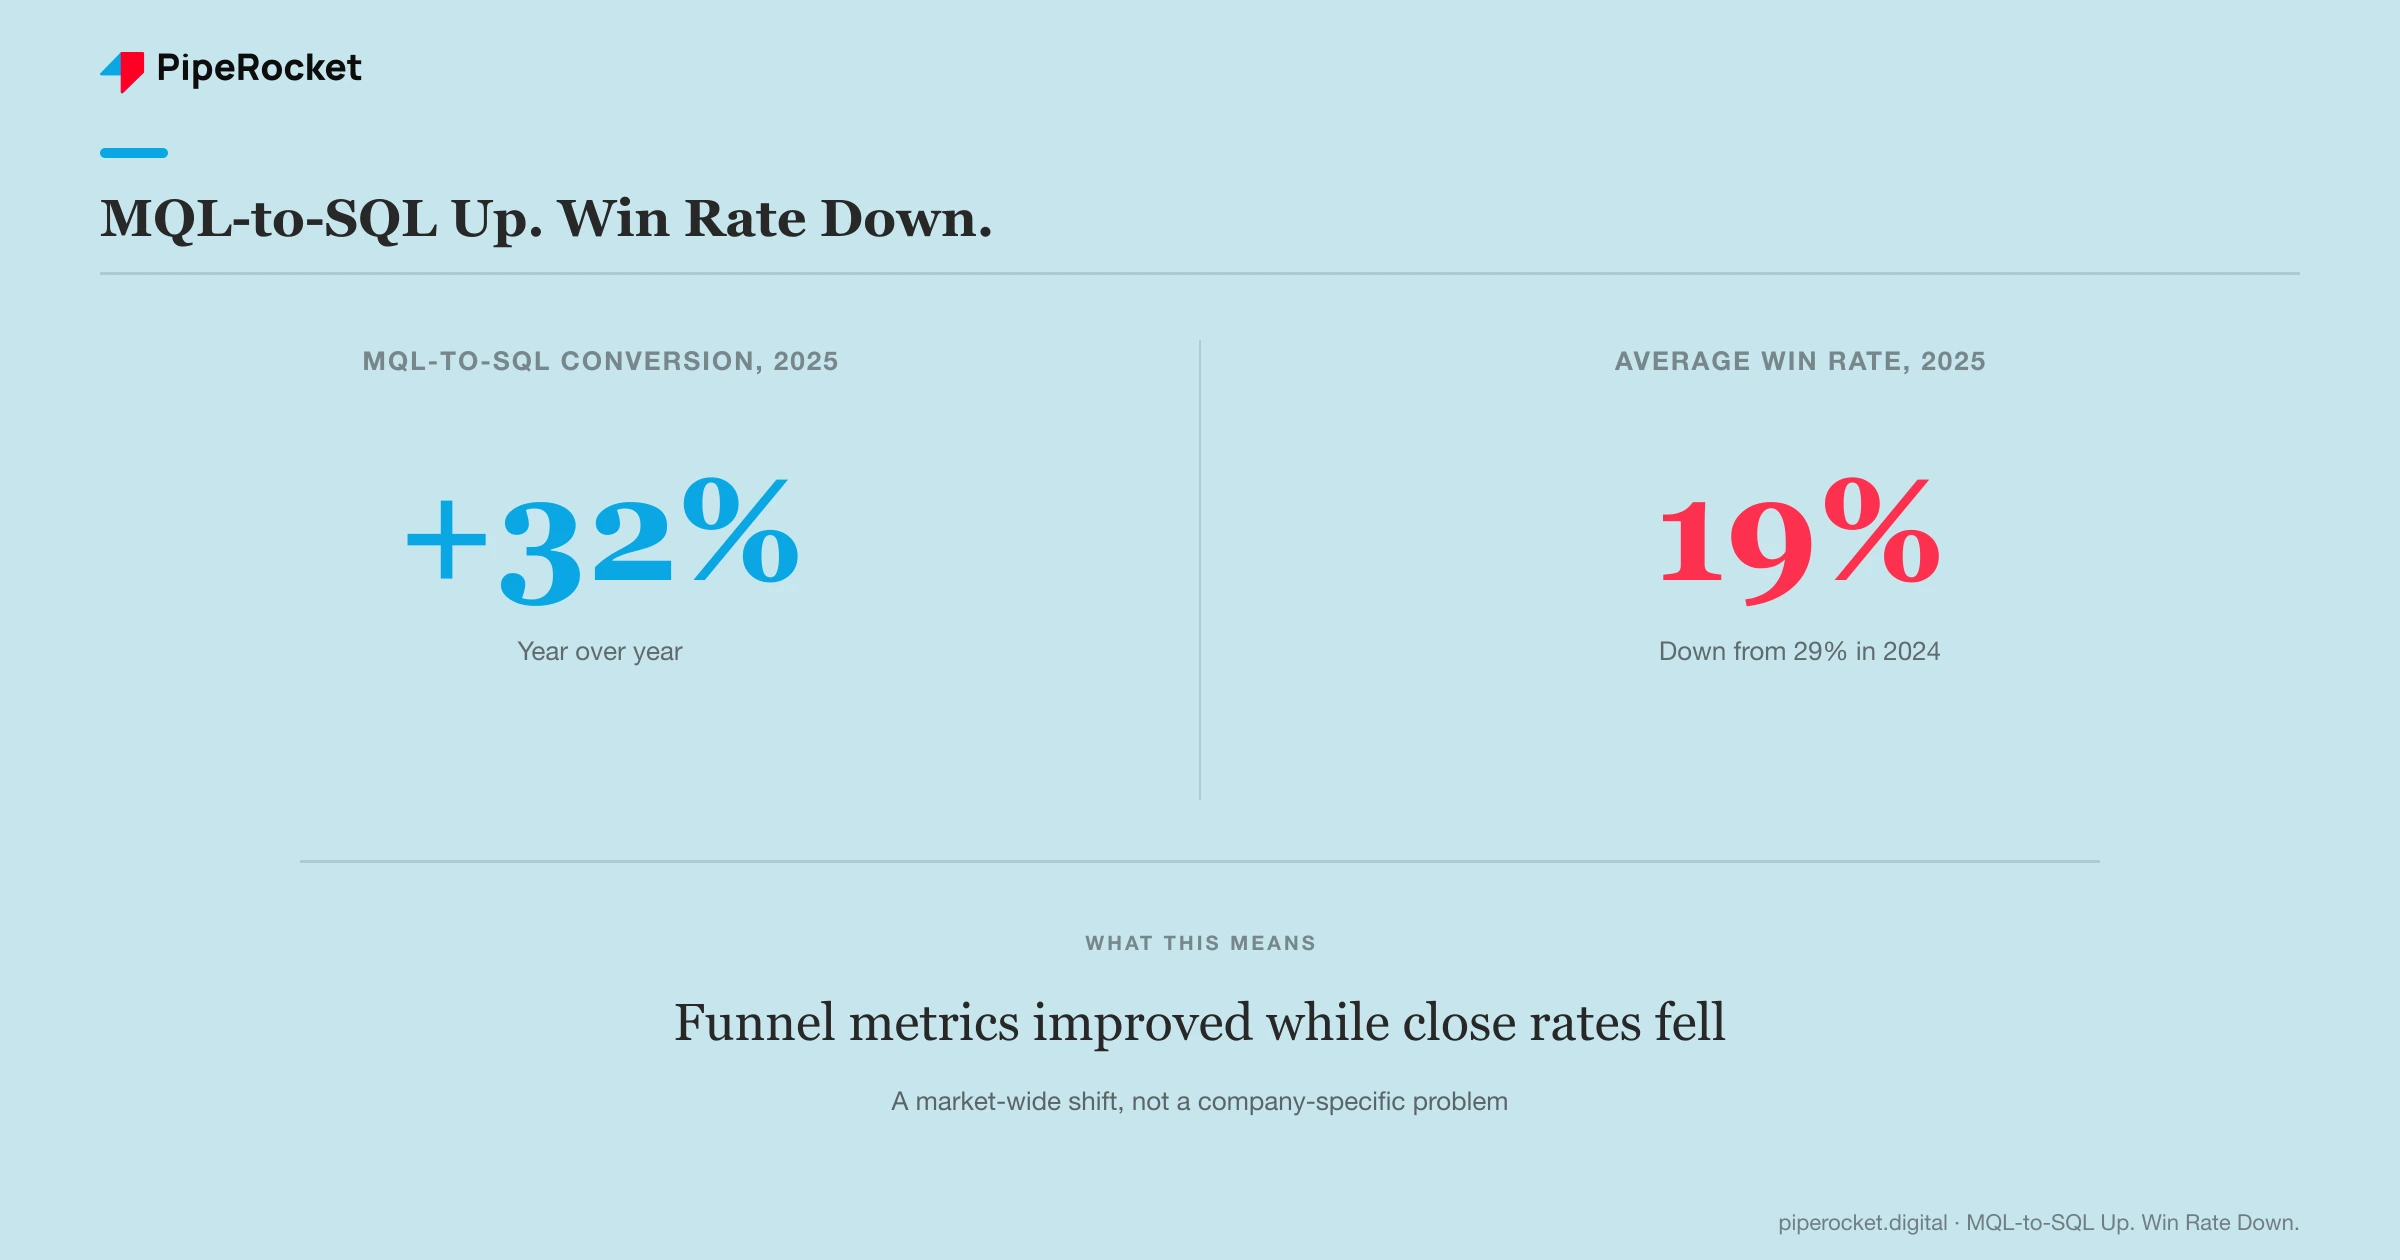
MQL-to-SQL conversion rose 32% year over year in 2025. The average B2B win rate fell to 19%, down from 29% the year before. More qualified leads and fewer closed deals, in the same dataset, in the same year. If your funnel metrics are improving while your close rate slides, that’s the market moving, not a company-specific problem.
We pulled the most recent named B2B marketing research available, from the Ebsta x Pavilion GTM Benchmarks Report, 6sense, Champify, and Content Marketing Institute, and checked every figure against a live, dated source.
Key Takeaways
- The average B2B win rate fell to 19% in 2025, down from 29% in 2024, even as MQL-to-SQL conversion rose 32%.
- 94% of buying groups rank a preferred vendor before contacting a seller, and that pre-ranked vendor wins the deal 80% of the time.
- Deals sourced through a former customer or champion close at 2.8x the average B2B SaaS win rate.
- The average B2B buyer journey involves 88 touchpoints across 4 channels, up from 76 touchpoints across 3.7 channels the year before.
- Just 14% of sellers generate 80% of total revenue, an 11x velocity gap between top and bottom performers.
- 78% of sellers missed quota in 2025, up from 69% in 2024.
- SEM/PPC was rated the most effective paid channel by 61% of B2B marketers, and LinkedIn was rated the best-value social platform by 85%.
B2B Sales Cycle Length and Deal Complexity
- The average B2B buyer journey now involves 88 touchpoints across 4 channels, up from 76 touchpoints across 3.7 channels the prior year, and runs 272 days from first touch to revenue, up from 211 days. (Dreamdata, B2B Customer Journey, 2025-2026 )
- The average B2B buying cycle, self-reported by buyers, shortened to 10.1 months in 2025, down from 11.3 months in 2024. Buyers now initiate contact with sales at roughly 61% through their journey, down from 69% the year before. (6sense, 2025 B2B Buyer Experience Report, November 2025 )
- Buyers evaluate an average of 5.1 vendors, up from 4.5 the prior year, but narrow to a Day-One shortlist of 3.6. (6sense, November 2025 )
- Top-performing B2B sellers’ average sales cycle runs 42% shorter than average performers, contributing to an 11x revenue-per-day gap between top and bottom performers. (Ebsta x Pavilion 2025 GTM Benchmarks Report )
Our take: the buying cycle is getting shorter on paper (11.3 to 10.1 months) while the touchpoint count is climbing (76 to 88). Buyers aren’t spending less effort. They’re compressing more research into less calendar time, largely because AI tools let them move through independent research faster than before.
MQL-to-SQL and Lead-to-Customer Conversion Benchmarks
- MQL -to-SQL conversion rose 32% year over year in 2025, one of the largest single-metric swings in the dataset. In the same period, new-logo win rate fell 10% relative, and gross revenue retention fell 8% relative. (Ebsta x Pavilion 2025 GTM Benchmarks Report )
- Lead volume rose 20% year over year in the same cohort, even as new-logo win rates fell, meaning more leads did not translate into proportionally more closed business. (Ebsta x Pavilion 2025 GTM Benchmarks Report )
- Deals sourced through a former customer or champion relationship close at a 37% win rate, versus 19% for cold outreach, a 2.8x lift. Contact-to-opportunity conversion for champion-sourced leads runs 5.40%, versus 2% for cold outbound. (Champify 2025 Impact Report )
Our take: rising MQL-to-SQL conversion alongside falling win rates is the clearest signal in this entire research pass that funnel-stage metrics can improve while the business gets worse. If your qualification numbers look better this year, check whether your close rate actually moved with them before calling it progress.
Self-Serve vs. Sales-Assisted B2B Buying
- 94% of buying groups rank their preferred vendor before ever contacting a seller. That pre-ranked vendor wins the deal 80% of the time, versus only 57% when the shortlist is unranked before contact. (6sense, November 2025 )
- 78% of buyers chose a solution they had prior familiarity with when shortlisting, and 81% of enterprise buyers selected a product they had personally used before. “Your own prior experience” was the only influence source that grew year over year, while product demos, user reviews, and free trials all declined in influence. (TrustRadius Buying Disconnect Report, via Champify )
- Winning vendors still average 16 direct interactions per buyer during the purchase process, essentially unchanged despite the shorter overall timeline. (6sense, November 2025 )
Our take: if 94% of buying groups have already ranked a favorite before any seller contact, most demand-gen measurement is instrumenting the wrong phase of the funnel. The deal is substantially decided in the independent research window most marketing teams can’t see or track at all.
Multi-Touch Attribution and Measurement Challenges
- 56% of B2B marketers say they have difficulty attributing ROI to content, and the same share struggle to track the customer journey. Only 51% agree their organization measures content performance effectively. (Content Marketing Institute, B2B Content Marketing Trends 2025 )
- Multi-touch attribution is used by 58% to 60% of B2B marketing organizations, but only 18% to 20% use statistical or algorithmic modeling, the method generally regarded as most accurate. The rest rely on simpler first-touch or last-touch rules. (6sense, State of B2B Marketing Metrics, June 2025 )
B2B Channel Mix and Effectiveness
- In-person events (52%) and webinars (51%) were rated the two most effective B2B distribution channels, ahead of email (42%) and organic social (42%). (Content Marketing Institute, 2025 )
- Among paid channels, SEM/PPC was rated most effective by 61% of B2B marketers, ahead of paid social at 49%. (Content Marketing Institute, 2025 )
- 85% of B2B marketers say LinkedIn delivers the best value of any social platform, far ahead of Facebook at 28%. Video was rated the most effective content format by 58%. (Content Marketing Institute, 2025 )
- The average B2B email open rate is 39.48%, with a 2.21% click-through rate . (HubSpot, Email Open Rate Benchmark, November 2025 )
B2B Win Rates and Deal Size Benchmarks
- The average B2B win rate fell to 19% in 2025, down from 29% in 2024, a market-wide compression measured across 655,000 opportunities and $48 billion in pipeline. 78% of sellers missed quota, up from 69% the year before. (Ebsta x Pavilion 2025 GTM Benchmarks Report )
- Just 14% of sellers now generate 80% of total revenue, an 11x revenue-per-day gap between top and bottom performers. Top performers manage 2.64x more deals, command 76% higher deal values, and close at 43% higher win rates. (Ebsta x Pavilion 2025 GTM Benchmarks Report )
- Involving a decision-maker in the first two stages of the sales process lifts win rates 50%. If that decision-maker’s engagement stays high through the cycle, win rate roughly quadruples. (Ebsta x Pavilion 2025 GTM Benchmarks Report )
- Sellers spend an average of just 21% of the working day actively engaging with customers. Top performers at AI-enabled companies spend 43%, roughly double. (Ebsta x Pavilion 2025 GTM Benchmarks Report )
Our take: sellers spending only a fifth of their day with customers is a capacity problem, not a demand problem. If your sales cycle feels stuck, more leads won’t fix a bottleneck that’s actually about how much of a rep’s day goes to selling versus everything else on their plate.
What This Means for Your B2B Marketing Strategy in 2026
- Track win rate alongside MQL-to-SQL conversion, rather than in its place. The 2025 data shows both moving in opposite directions in the same market. A rising qualification metric doesn’t guarantee a healthier funnel.
- Invest in advocate and champion relationships alongside net-new outreach. Champion-sourced deals close at nearly 3x the rate of cold outbound, and familiarity is the only buyer-influence source growing year over year.
- Instrument the independent research phase, ahead of the sales-contact phase. With most buying groups deciding on a favorite before first contact, your visibility gap is earlier than your CRM shows.
- Check whether your sales bottleneck is actually a capacity problem. If reps are spending most of their day on anything other than selling, more leads will just pile up against the same ceiling.
If you want a B2B marketing program built around what actually converts to revenue instead of funnel-stage vanity metrics, our B2B marketing agency team can show you where the gaps are. Talk to us .