150+ Lead Generation Statistics (Updated October 2026)
 Kamaraj Mathiarasan (Kim)
Last updated on
Kamaraj Mathiarasan (Kim)
Last updated on
94% of buying groups rank a preferred vendor before ever engaging with a seller, and that early favorite wins the deal 77% of the time. If that’s accurate, the lead-scoring funnel most teams run is measuring people after they’ve already decided, not before.
We pulled the most recent named lead generation research available, from Ruler Analytics, HubSpot, 6sense, and InsideSales, and checked every figure against a live, dated source. Several widely repeated lead-nurturing stats trace back to research from before 2020 still being recycled as current. We flag those explicitly.
Key Takeaways
- The average blended B2B cost per lead is $84, ranging from $91 for ecommerce to $649 for legal services.
- By channel, cost per lead ranges from $25 for referrals to $840 for trade shows and events.
- The average B2B lead conversion rate is 5.13%, and roughly 40% of B2B conversions happen by phone, not by form fill.
- Leads contacted within 5 minutes convert 8x more often than leads contacted between 5 minutes and 24 hours later, yet only 0.1% of leads actually get contacted that fast.
- Conversion drops from 23.1% at 3 form fields to 6.9% at 10-plus fields.
- 94% of buying groups rank a preferred vendor before ever engaging a seller, and that early favorite wins 77% of the time.
- For B2B SaaS specifically, organic search generates 37x more leads than every AI referral source combined.
Lead Generation Channel Effectiveness and Cost Per Lead
- The average blended B2B cost per lead is $84, ranging from $91 for ecommerce up to $649 for legal services and $653 for financial services. (HubSpot, CPL and CAC Benchmarks, updated September 2026 )
- By channel, average cost per lead ranges from $25 for referrals to $73 for affiliate marketing, $142 for Facebook Ads, $206 for SEO, $225 for cold email, $267 for webinars, $408 for paid LinkedIn, $463 for PPC, and $840 for trade shows and events, the highest of all channels measured. (Sopro, B2B Cost Per Lead Benchmarks, September 2025 )
- Blended cost per lead has held nearly flat since 2023, down just 0.23%, despite the AI tooling boom across marketing teams over the same period. (Sopro, September 2025 )
- MQL-to-SQL conversion rates by channel: SEO converts at 51%, email marketing at 46%, webinars at 30%, PPC at 26%, and events at 24%. (HubSpot, 2026 )
Our take: AI adoption across marketing teams has climbed sharply since 2023, yet blended cost per lead barely moved. If AI tooling were disrupting lead-gen economics the way it’s often pitched, cost per lead should show it by now. So far, the market-wide data doesn’t.
Lead Conversion Rate Benchmarks
- Across 13 industries, 110 million-plus tracked sessions, and £33.8 million-plus tracked spend, the overall average lead conversion rate is 5.13%, ranging from 1.9% in travel to 7.9% in automotive and legal. (Ruler Analytics, Conversion Rate Benchmarks 2026, May 2026 )
- By channel, conversion rates run 5.8% for AI referral, 5.4% for paid search, 4.9% for organic search, 4.9% for email, and just 2.23% for organic social. (Ruler Analytics, May 2026 )
- The overall conversion rate splits into a 1.7% form conversion rate and a 1.2% call conversion rate, meaning roughly 40% of B2B conversions happen by phone rather than form. In marketing and advertising specifically, that split runs 95.1% form versus just 4.9% call. (Ruler Analytics, May 2026 )
- Based on 41,000-plus landing pages and 464 million-plus visitors, the median landing page conversion rate is 6.6%, ranging from 3.8% for SaaS to 12.3% for events and entertainment. (Unbounce, Conversion Benchmark Report )
Our take: the call-versus-form split is the most useful correction in this data. Teams that measure lead generation purely by form conversion rate are missing roughly 40% of what’s actually converting, especially in categories like legal (56.3% by call) where phone conversion outweighs forms entirely. If your reporting only counts forms, your real lead volume is higher than your dashboard shows.
Lead Response Time and Follow-Up Statistics
- Based on 55 million-plus sales activities across 5.7 million inbound leads, conversion rates are 8x greater when a lead is contacted within 5 minutes versus a response given between 5 minutes and 24 hours later. (InsideSales, Response Time Matters )
- Despite that advantage, only 0.1% of inbound leads are actually engaged within 5 minutes, and 57.1% of first call attempts happen more than a week after the lead comes in. (InsideSales )
- An analysis of 4 million form submissions found instant response achieves a 66.7% meeting-booking rate, versus 30% for standard, delayed follow-up. (Chili Piper, Speed to Lead Statistics )
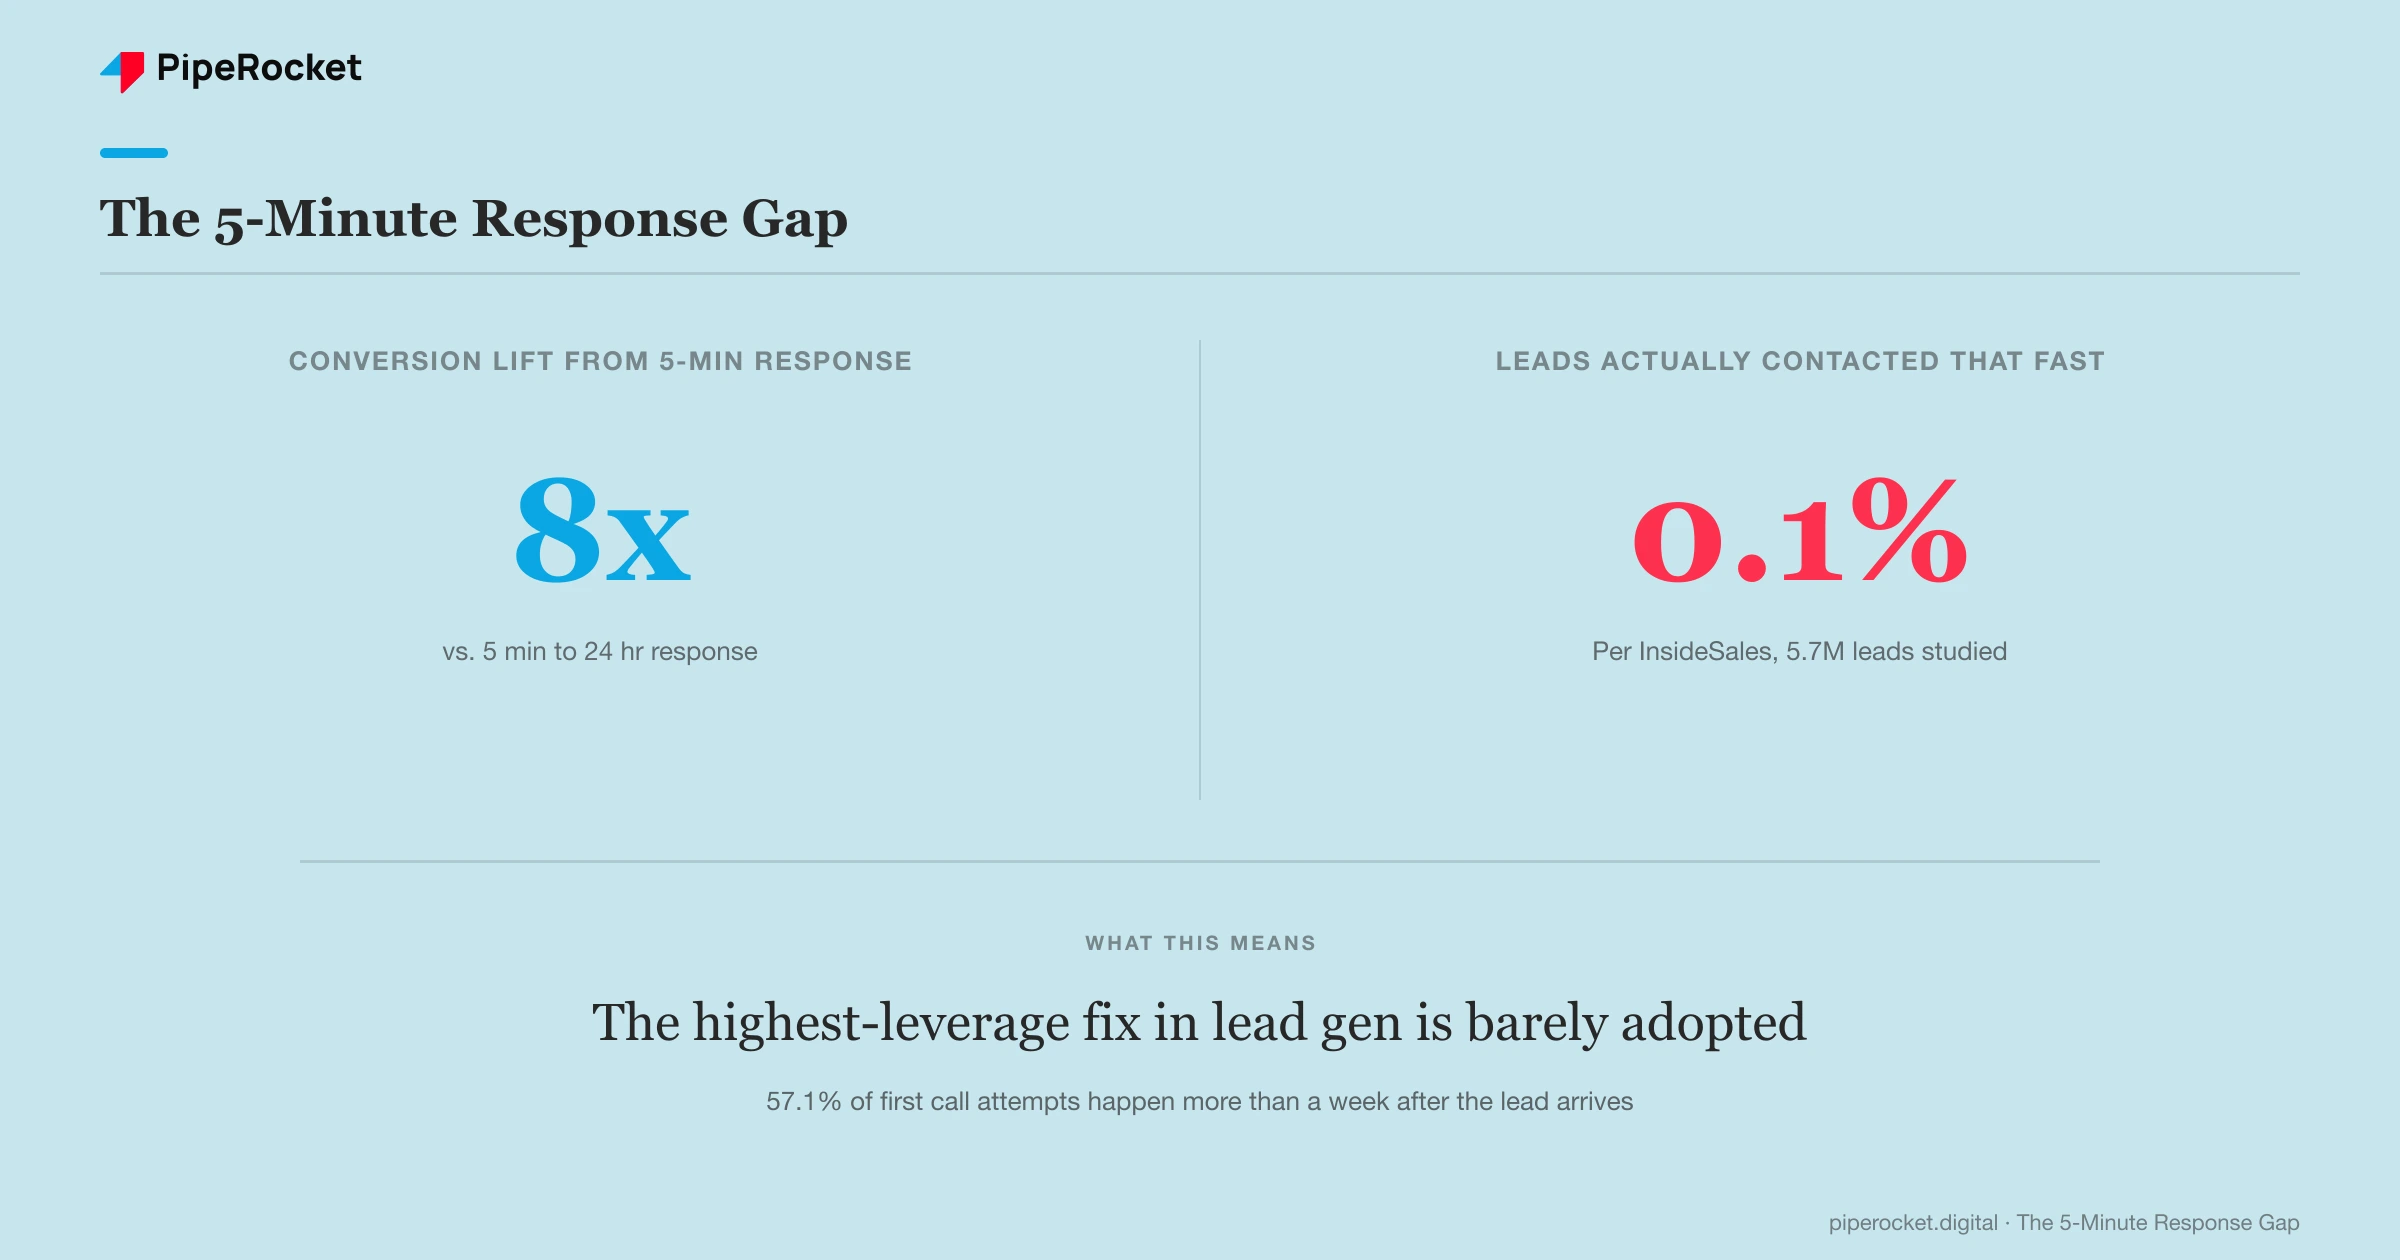
Our take: the gap between “everyone knows this stat” and “almost nobody acts on it” is the real story here. The 8x-conversion, 5-minute-response finding has circulated for over a decade, and the response-time data still shows only 0.1% of leads getting contacted that fast. Fixing lead routing speed is one of the few improvements in this entire research pass with a well-documented payoff and near-zero adoption.
Form Conversion Rate Benchmarks
- Conversion drops sharply as form field count rises: 23.1% at 3 fields, 17.0% at 5 fields, 11.4% at 7 fields, and 6.9% at 10 or more fields, with the steepest drop-off between 5 and 7 fields. (Industry form-benchmark compilation, 2026 )
- Desktop landing pages convert about 8% better than mobile, even though mobile accounts for 83% of all landing page visits. (Unbounce, Conversion Benchmark Report )
- Copy written at a 5th to 7th grade reading level converts at 11.1%, versus 5.3% for professional-level copy. (Unbounce )
Lead Quality vs. Quantity Challenges
- 93.8% of marketers say their lead quality has improved over the past year, while lead generation still ranks as the #3 overall marketing challenge, cited by roughly 30% of marketers. (HubSpot, 2026 Marketing Statistics )
- 94% of buying groups rank their preferred vendor before ever engaging with a seller, and that early favorite goes on to win the deal 77% of the time. (6sense, 2025 B2B Buyer Experience Report, November 2025 )
- The average B2B buying cycle compressed from 11.3 months in 2024 to 10.1 months in 2025, and buyers now initiate contact with sales at roughly 61% through their journey. (6sense, November 2025 )
Our take: if 94% of buying groups have already picked a favorite before any contact, classic MQL scoring is measuring a decision that mostly already happened. The real lead-generation battle is earlier than most funnels account for, in the independent research phase your scoring model can’t see at all.
AI’s Role in Lead Generation
- 95% of B2B marketing organizations now use AI-powered applications, and 89% report improved productivity from AI-assisted content creation. (Content Marketing Institute/MarketingProfs, October 2025 )
- 80% of marketers use AI for content creation and 75% use it for media production. (HubSpot, 2026 Marketing Statistics )
Lead Generation Statistics for SaaS Companies
Everything above is blended across industries and lead sources. Here’s what lead generation actually looks like for B2B SaaS, pulled from our own research across 65+ Google Ads accounts and 53 B2B SaaS brands we’ve studied. (PipeRocket Digital, Google Ads Benchmarks and AI SEO Statistics, October 2026 )
- The average B2B SaaS Google Ads account generates leads at $84 blended cost per lead, with non-brand search running $207 per lead versus $34 for brand search.
- Organic search generates 37x more leads in absolute terms than every AI referral source combined, across the 53 B2B SaaS brands we tracked over 8 months.
- Organic search visitors convert to leads at 0.92%, roughly 3.5x higher than AI-referred visitors at 0.26%, in that same dataset.
- Performance Max delivers the cheapest SaaS lead at $25, though those conversions blend in lower-intent traffic, so treat the number as volume rather than a like-for-like comparison to Search’s $143 per lead.
Our take: the cross-industry data above shows AI referral converting at a higher rate than organic search (5.8% versus 4.9%) in a general benchmark study. Our own SaaS-specific data shows the opposite: organic converts at more than 3x the rate of AI referral traffic. The difference is likely the query type each channel captures for SaaS specifically, and it’s a reminder that a cross-industry average can point the wrong direction for your category.
What This Means for Your Lead Generation Strategy in 2026
- Count phone conversions alongside form fills. Roughly 40% of B2B conversions happen by call. A form-only dashboard is undercounting your real lead volume.
- Fix response speed before anything else. The 8x conversion lift from 5-minute response has been documented for over a decade and still isn’t widely adopted. It’s one of the highest-leverage, lowest-cost fixes available.
- Front-load content into the independent research phase. With most buying groups deciding on a favorite before first contact, the content that reaches them earliest matters more than what you save for a sales call.
- Don’t assume a cross-industry benchmark applies to your category. Our own SaaS data on organic-versus-AI conversion ran opposite to the general benchmark. Check your own numbers before trusting an industry-wide average.
If you want a lead generation program built on channel data specific to B2B SaaS instead of blended industry averages, our SaaS SEO agency team can show you where the gaps are. Talk to us .