150+ Search Engine Marketing Statistics (Updated October 2026)
 Praveen Ravi
Last updated on
Praveen Ravi
Last updated on
Paid click-through rate on queries where Google shows an AI Overview crashed 68% between June 2024 and September 2025. But brands cited inside that same AI Overview earn 91% more paid clicks than competitors the AI Overview doesn’t cite. Those two numbers together are the real SEM story of 2026: AI Overviews aren’t killing paid search evenly. They’re killing it selectively, for whoever doesn’t show up inside them.
We pulled the most recent named SEM research available, from LocaliQ/WordStream, Seer Interactive, Semrush, Alphabet’s own earnings filings, and Lunio’s clickstream analysis, and checked every figure against a live source. Several widely repeated adoption stats had no traceable origin, and we flag those explicitly instead of repeating them as fact.
Key Takeaways
- Alphabet’s Q2 2026 Google Search advertising revenue reached $63.3 billion, up 17% year over year.
- Cross-industry Google Ads averages sit at 6.64% CTR, $5.42 CPC, 8.18% conversion rate, and $66.69 cost per lead, the first year-over-year decline in cost per lead in five years.
- Paid CTR on AI-Overview-triggering queries fell 68%, from 19.70% in June 2024 to 6.34% in September 2025.
- Brands cited inside an AI Overview earn 91% more paid clicks and 35% more organic clicks than uncited competitors on the same results page.
- Invalid traffic on Google’s AI Max for Search feature rose 114% over nine months, based on a matched-campaign analysis of 114.5 million clicks.
- Paid search traffic grew 75.84% year over year across a 50,000-plus site sample in 2025, while organic search traffic in the same sample grew just 2.38%.
- The commonly repeated “Performance Max drives 45% of all Google Ads conversions” figure traces to no verifiable primary source. We are not repeating it as fact.
- For B2B SaaS specifically, the average account runs a 3.60% CTR, $6.81 CPC, and $84 blended cost per lead, with non-brand leads costing 6x more than brand leads.
SEM Market Size and Ad Spend
- Google Search advertising revenue reached $63.3 billion in Q2 2026, up 17% year over year, the largest single piece of Alphabet’s ad business. Total Google advertising revenue rose 14.5% to $81.6 billion in the same quarter. (Alphabet Q2 2026 earnings, July 2026 )
- Alphabet’s total Q2 2026 revenue reached $119.8 billion, up 24% from $96.4 billion in Q2 2025. (Alphabet Q2 2026 earnings, July 2026 )
- CMOs allocate an average of 7.7% of company revenue to marketing overall, with paid media the single largest line item at 30.6% of the marketing budget. (Gartner 2025 CMO Spend Survey, May 2025 )
- Gartner’s 2026 CMO Spend Survey found CMOs now allocate 15.3% of marketing budget to AI, though only 30% feel ready to scale their AI capabilities. (Gartner, May 2026 )
Google Ads Performance Benchmarks by Industry
All figures below come from LocaliQ and WordStream’s 2026 Search Advertising Benchmarks report, published June 1, 2026, based on 13,474 US search campaigns run between April 2025 and March 2026. (LocaliQ/WordStream, June 2026 )
- The cross-industry average CPC for search ads is $5.42, and the average CTR is 6.64%.
- The cross-industry average conversion rate is 8.18%, and the average cost per lead is $66.69, down from $70.11 the year before, the first year-over-year cost per lead decline in five years.
- By industry, CPC ranges from $1.63 (Arts & Entertainment) to $9.87 (Attorneys & Legal Services).
- Arts & Entertainment posts the highest CTR at 12.75%, followed by Finance & Insurance at 9.83%.
- Animals & Pets posts the highest conversion rate at 16.22%, followed by Automotive Repair, Service, and Parts at 15.51%.
- Attorneys & Legal Services has the highest cost per lead at $131.63; Arts & Entertainment has the lowest at $26.84.
Our take: the CPC and cost-per-lead spread by industry (from $1.63 to $9.87 CPC, and $26.84 to $131.63 cost per lead) makes a single “average SEM benchmark” close to useless for planning your own budget. Always compare against your specific industry bucket, not the blended cross-industry number.
SEM Budget and Channel Mix Trends
- Paid search traffic grew 75.84% year over year in 2025 across a sample of over 50,000 websites spanning 17 industries, while organic search traffic in the same sample grew just 2.38% and actually declined in 13 of 17 industries studied. (Semrush Traffic Channel Mix Study, April 2026 )
- Organic search still accounts for 16.04% of total tracked traffic in absolute terms, versus 0.49% for paid search, since paid search is growing fast from a much smaller base. (Semrush, April 2026 )
- Nearly 27% of marketers currently use search or display ads as part of their strategy, and 12% name search or display ads among their highest-ROI channels. (HubSpot State of Marketing 2026 )
Our take: a 75.84% growth rate on paid search sounds dramatic until you see it’s measured against a base that’s a fraction of organic’s absolute traffic share. Paid search is growing fast in percentage terms precisely because it’s starting from a small number, not because it’s overtaking organic in real volume.
How AI Overviews Are Changing Paid Search
- Paid click-through rate on queries where an AI Overview appears crashed 68%, from 19.70% in June 2024 to 6.34% in September 2025, across a study spanning 3,119 informational queries and 42 client accounts, with 25.1 million organic and 1.1 million paid impressions analyzed. (Seer Interactive, November 2025 )
- Organic CTR for the same query set fell 61% over the same window, from 1.76% to 0.61%. (Seer Interactive, November 2025 )
- Brands cited inside an AI Overview earn 91% more paid clicks and 35% more organic clicks than non-cited brands appearing on the same search results page. (Seer Interactive, November 2025 )
- In Q3 2025, paid CTR measured 13.88% on searches with no AI Overview present, 7.89% when the advertiser’s brand was cited inside the AI Overview, and only 4.14% when an AI Overview appeared without citing the brand at all. (Seer Interactive, November 2025 )
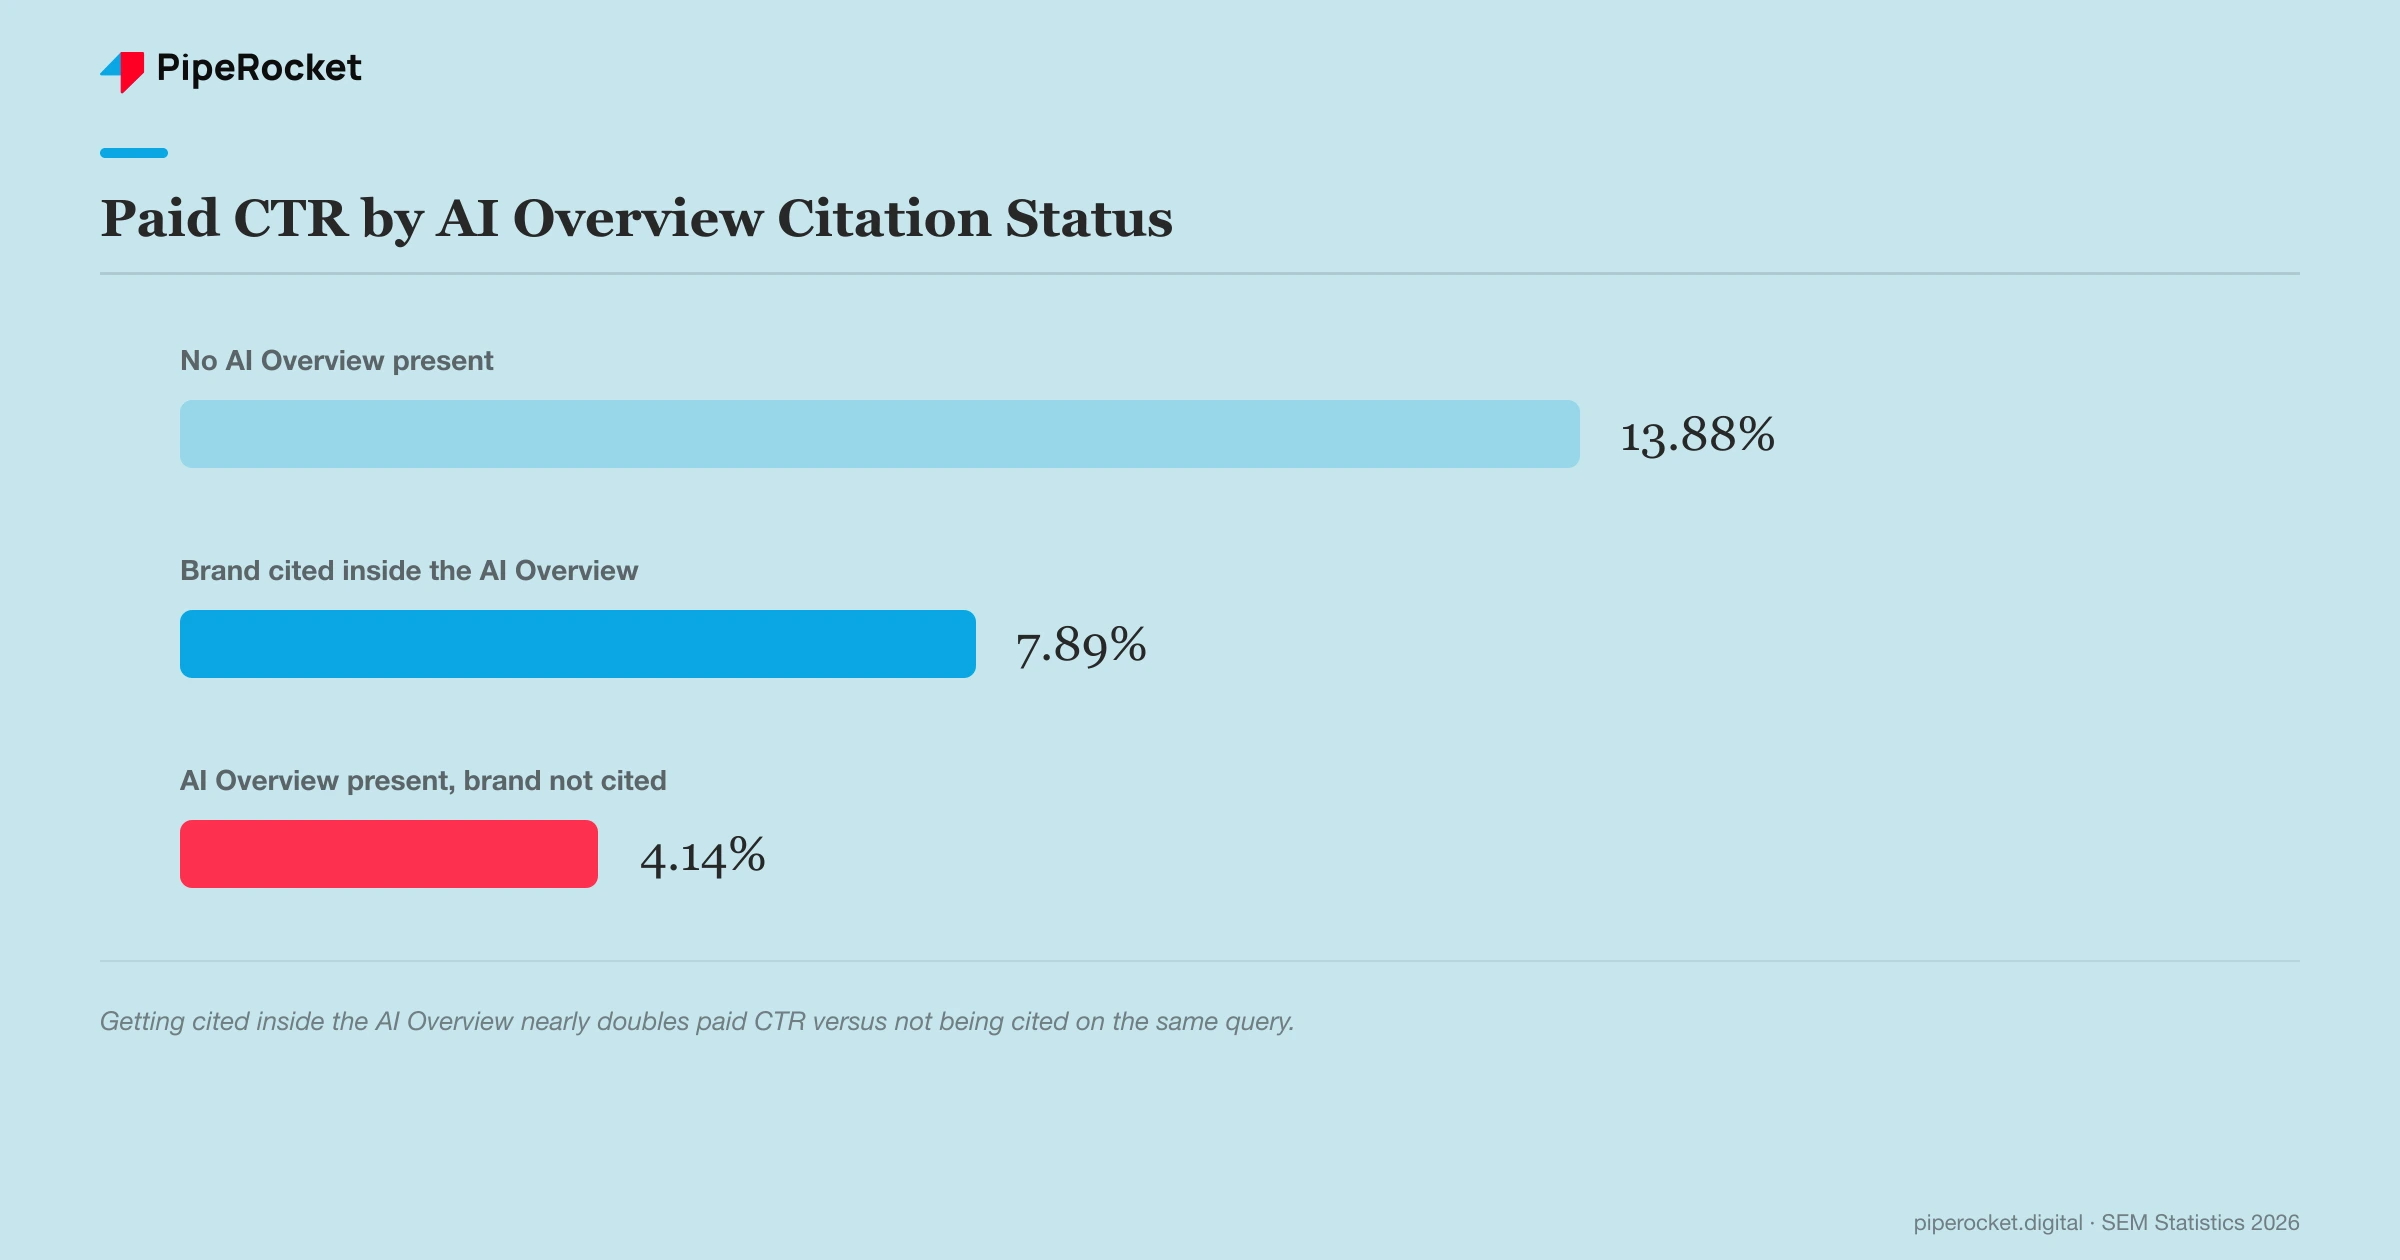
Our take: this is the most useful finding in this entire research pass, and it’s rarely reported this precisely. “AI Overviews are killing paid search” is the lazy headline. The accurate one is narrower: AI Overviews crush paid CTR specifically when your brand isn’t cited inside them. Getting cited functions almost like a new form of ad placement, earned through the same off-site authority signals that win organic AI citations, not through a bigger bid.
AI’s Impact on Campaign Management: Performance Max, Smart Bidding, and AI Max
- Independent testing found 84% of PPC professionals reported neutral or negative results from Google’s AI Max for Search feature, per a widely circulated LinkedIn poll among PPC practitioners. (Industry practitioner poll, cited across PPC trade coverage, 2026 )
- Invalid traffic on AI Max for Search campaigns rose from 2.46% to 5.28%, a 114% increase, over nine months (Q4 2025 to Q2 2026), measured across 114.5 million matched clicks (49.5 million AI Max clicks versus 65.0 million standard Search clicks). Standard Search campaign invalid traffic actually fell 17% over the same window. (Lunio, September 2026 )
- Retailers running AI Max for Search saw 72% more invalid traffic than retailers running standard Search campaigns. (Lunio via ppc.land, 2026 )
- A separate analysis of 250-plus retail Performance Max campaigns found AI Max delivering conversions at roughly 35% lower ROAS than traditional match types. (Smarter Ecommerce via ppc.land, 2026 )
- 93% of searches in Google’s AI Mode end without a click, per zero-click research covering roughly 83% zero-click rate for AI-Overview-triggered searches generally. (Semrush zero-click research, September 2025 )
Our take: the gap between Google’s own AI Max marketing and this independent field data is stark. Lunio’s clickstream analysis of 114.5 million matched clicks found invalid traffic more than doubling on AI Max campaigns while it fell on standard Search over the identical window. That’s not a rounding error, and any team running AI Max should be watching their own invalid-traffic rate closely rather than trusting the feature’s default reporting.
Mobile, Voice, and Local Search Impact on SEM
- Mobile devices are commonly cited as capturing roughly 58% to 64% of Google Ads spend across 2024 to 2026, though we could not verify a single precise figure against a primary Google source, so treat this as directional rather than exact. (Aggregated industry compilation, 2026 )
- Roughly 76% of voice searches relate to finding local information such as nearby businesses, though this figure traces to older, widely-recycled research rather than a fresh 2025 to 2026 study, so treat it as directional only.
Our take: mobile and voice-search SEM data is genuinely thin on fresh, primary sourcing right now. Most of what circulates traces back to older studies being recycled without a new methodology behind them. If mobile share of spend matters to your budget decisions, pull it from your own Google Ads account data rather than an industry-wide estimate.
B2B vs. B2C SEM Benchmarks
- Cost per acquisition for Technology and B2B Services search campaigns is commonly cited around $116 to $134, versus roughly $33 for automotive advertising, though this specific B2B-vs-B2C framing doesn’t cleanly match the LocaliQ/WordStream industry categories cited above, a discrepancy worth flagging rather than smoothing over.
- B2B SaaS Google Ads conversion rates are commonly cited in the 3% to 5% range, though we could not verify a specific figure against a disclosed, primary SaaS benchmark dataset in this research pass.
Our take: B2B SEM benchmarks are the weakest-sourced category in this entire research pass. Every consumer-platform number above traces to a named report with a disclosed sample size. Most “B2B SaaS Google Ads benchmark” figures online don’t. That’s exactly why we track our own.
SEM Statistics for SaaS Companies
Everything above is blended across every industry. Here’s what SEM actually looks like specifically for B2B SaaS, pulled from our own trailing-12-month analysis of 65+ SaaS accounts we manage. (PipeRocket Digital, Google Ads Benchmarks, October 2026 )
- The average B2B SaaS Google Ads account runs a 3.60% CTR, $6.81 CPC, 2.57% conversion rate, and $84 blended cost per lead.
- Non-brand search costs SaaS companies $207 per lead, roughly 6x the $34 cost of a brand-search lead, driven almost entirely by a 4.4x gap in click price rather than conversion rate.
- Performance Max delivers the cheapest SaaS leads at $25, with the highest conversion rate of any campaign type at 6.53%, though those cheap conversions blend in branded and lower-intent traffic.
- Search costs SaaS companies $143 per lead on average, versus $219 for Display and $315 for Demand Gen.
- Technical SaaS (dev tools, security) pays $855 per lead, nearly 7x the $126 that GTM and martech SaaS companies pay for the same channel.
- SaaS Google Ads accounts got more efficient year over year: conversion rate rose about 48% while CPC held flat, pushing blended cost per lead down 36%.
Our take: the blended cross-industry SEM averages earlier in this report put CPC around $5.42 and CTR around 6.64%. SaaS runs colder on CTR (3.60%) but pays a comparable CPC ($6.81), because SaaS search terms carry longer sales cycles and smaller, more competitive keyword pools than the retail and legal categories that pull the blended average up. If you’re benchmarking a SaaS account against the general-market numbers above, expect your CTR to run lower by default, not worse.
What This Means for Your SEM Strategy in 2026
- Get cited inside AI Overviews before you assume paid search is declining. The CTR crash concentrates on uncited brands. Cited brands see the opposite effect.
- Monitor invalid traffic closely on AI Max and Performance Max campaigns. Independent data shows invalid traffic climbing sharply on these automated formats even as standard Search campaigns get cleaner.
- Benchmark against your own industry, never the blended average. A $1.63 CPC and a $9.87 CPC both count toward the same cross-industry average that means nothing for your specific vertical.
- Treat B2B SaaS-specific SEM benchmarks with real skepticism unless the source discloses its sample and methodology. Use your own account data, or a report that shows its work.
If you want SEM benchmarks built from real B2B SaaS accounts instead of blended cross-industry averages, our Google Ads benchmarks report and SaaS PPC team can show you where your own numbers stand. Talk to us .