How to Prove SEO ROI for SaaS (Without Vanity Metrics)
 Ranjeeth Kumar
Last updated on
Ranjeeth Kumar
Last updated on

Most SaaS SEO reports prove the wrong thing. They open with a rankings chart, a traffic line going up and to the right, and a “domain authority” number nobody outside the team understands.
That report tells your CFO the channel is busy. It doesn’t tell her it pays. And when budget season comes, “busy” gets cut.
Here’s how we actually prove SEO ROI: by tying organic to pipeline and revenue, page by page, with numbers that survive the questions a finance team will ask.
TL;DR
- Traffic and rankings aren’t ROI, they’re activity: A dashboard full of vanity metrics tells leadership the channel is working hard rather than returning money, so prove pipeline instead.
- Attribute organic to pipeline by page type: Tag organic-sourced leads, trials, and demos, then judge each page against its own conversion benchmark rather than one blended number.
- Account for the dark funnel before you report: A chunk of organic’s real impact shows up as branded and direct traffic that standard attribution never credits back to SEO.
- Build the math against a cost benchmark: Organic-attributed pipeline value over fully-loaded SEO cost, weighed against the 10-15% of marketing spend SEO typically takes.
- Report on a cadence leadership trusts: A quarterly pipeline-attributed number with a consistent method beats a monthly traffic chart nobody acts on.
Why a Rankings Dashboard Will Never Prove ROI
A rankings dashboard proves you’re working, but it can’t prove you’re earning. Those are different questions, and the second one is the only one leadership funds.
Most SaaS teams report SEO like this: keywords ranking on page one, total organic sessions, a domain rating from a tool. Every number goes up, the deck looks great, and the CFO still doesn’t know what she got for the spend.
The problem is that none of those numbers connect to money. Rankings can climb while pipeline stays flat. Traffic can double on terms that never buy.
Our team has a phrase for this: own outcomes, not output. Most agencies report tasks completed and charts trending up. That’s output. ROI lives one layer down, in the pipeline that output did or didn’t create.
Warning: More traffic can actively hide a failing program. If you’re celebrating a 40% traffic lift driven by top-of-funnel terms that convert at well under 1%, you’re growing the number that looks impressive and starving the number that pays. Leadership claps for the chart, then quietly wonders why pipeline didn’t move.
The fix is a different denominator. Stop measuring how many people arrived and start measuring how many entered the pipeline, what they were worth, and what it cost to get them. If even the pipeline number stays flat, that’s a separate problem, and it’s worth pausing to diagnose why the traffic isn’t driving pipeline before you build any ROI report on top of it. That’s the rest of this guide.
Step 1: Report Organic-Attributed Pipeline, Not Sessions
Replace the traffic number with a pipeline number. The single most useful thing you can report is how much qualified pipeline organic search sourced this period, full stop.
That means tracking, for organic search specifically:
- Marketing-qualified leads (MQLs)
- Free trials or product sign-ups
- Demo or sales-call requests
- Opportunities created
- Closed-won revenue (the number finance actually cares about)
You get this by tagging the source. Set up your forms and CRM so every lead carries the channel that created it, then segment by organic. Most teams have the tooling already; they just never look at it past the session count. If your CRM and analytics don’t connect the channel to the closed deal cleanly, the SEO attribution tools built for this stitch first-touch and multi-touch organic credit back to pipeline so you aren’t reconstructing the path by hand.
One nuance worth flagging. The close rate on organic leads is usually different from paid, and from social, so don’t blend them. We’ve consistently seen organic convert to qualified pipeline at a healthy clip relative to other channels, which is exactly the argument you want to make: organic doesn’t just bring volume, it brings traffic that closes.
If your stack can’t tie a form fill back to organic search today, that’s step zero. You can’t prove ROI on a channel you can’t attribute. Fix the tracking before you build the report, because the whole ROI case rests on being able to trace a lead back to organic.
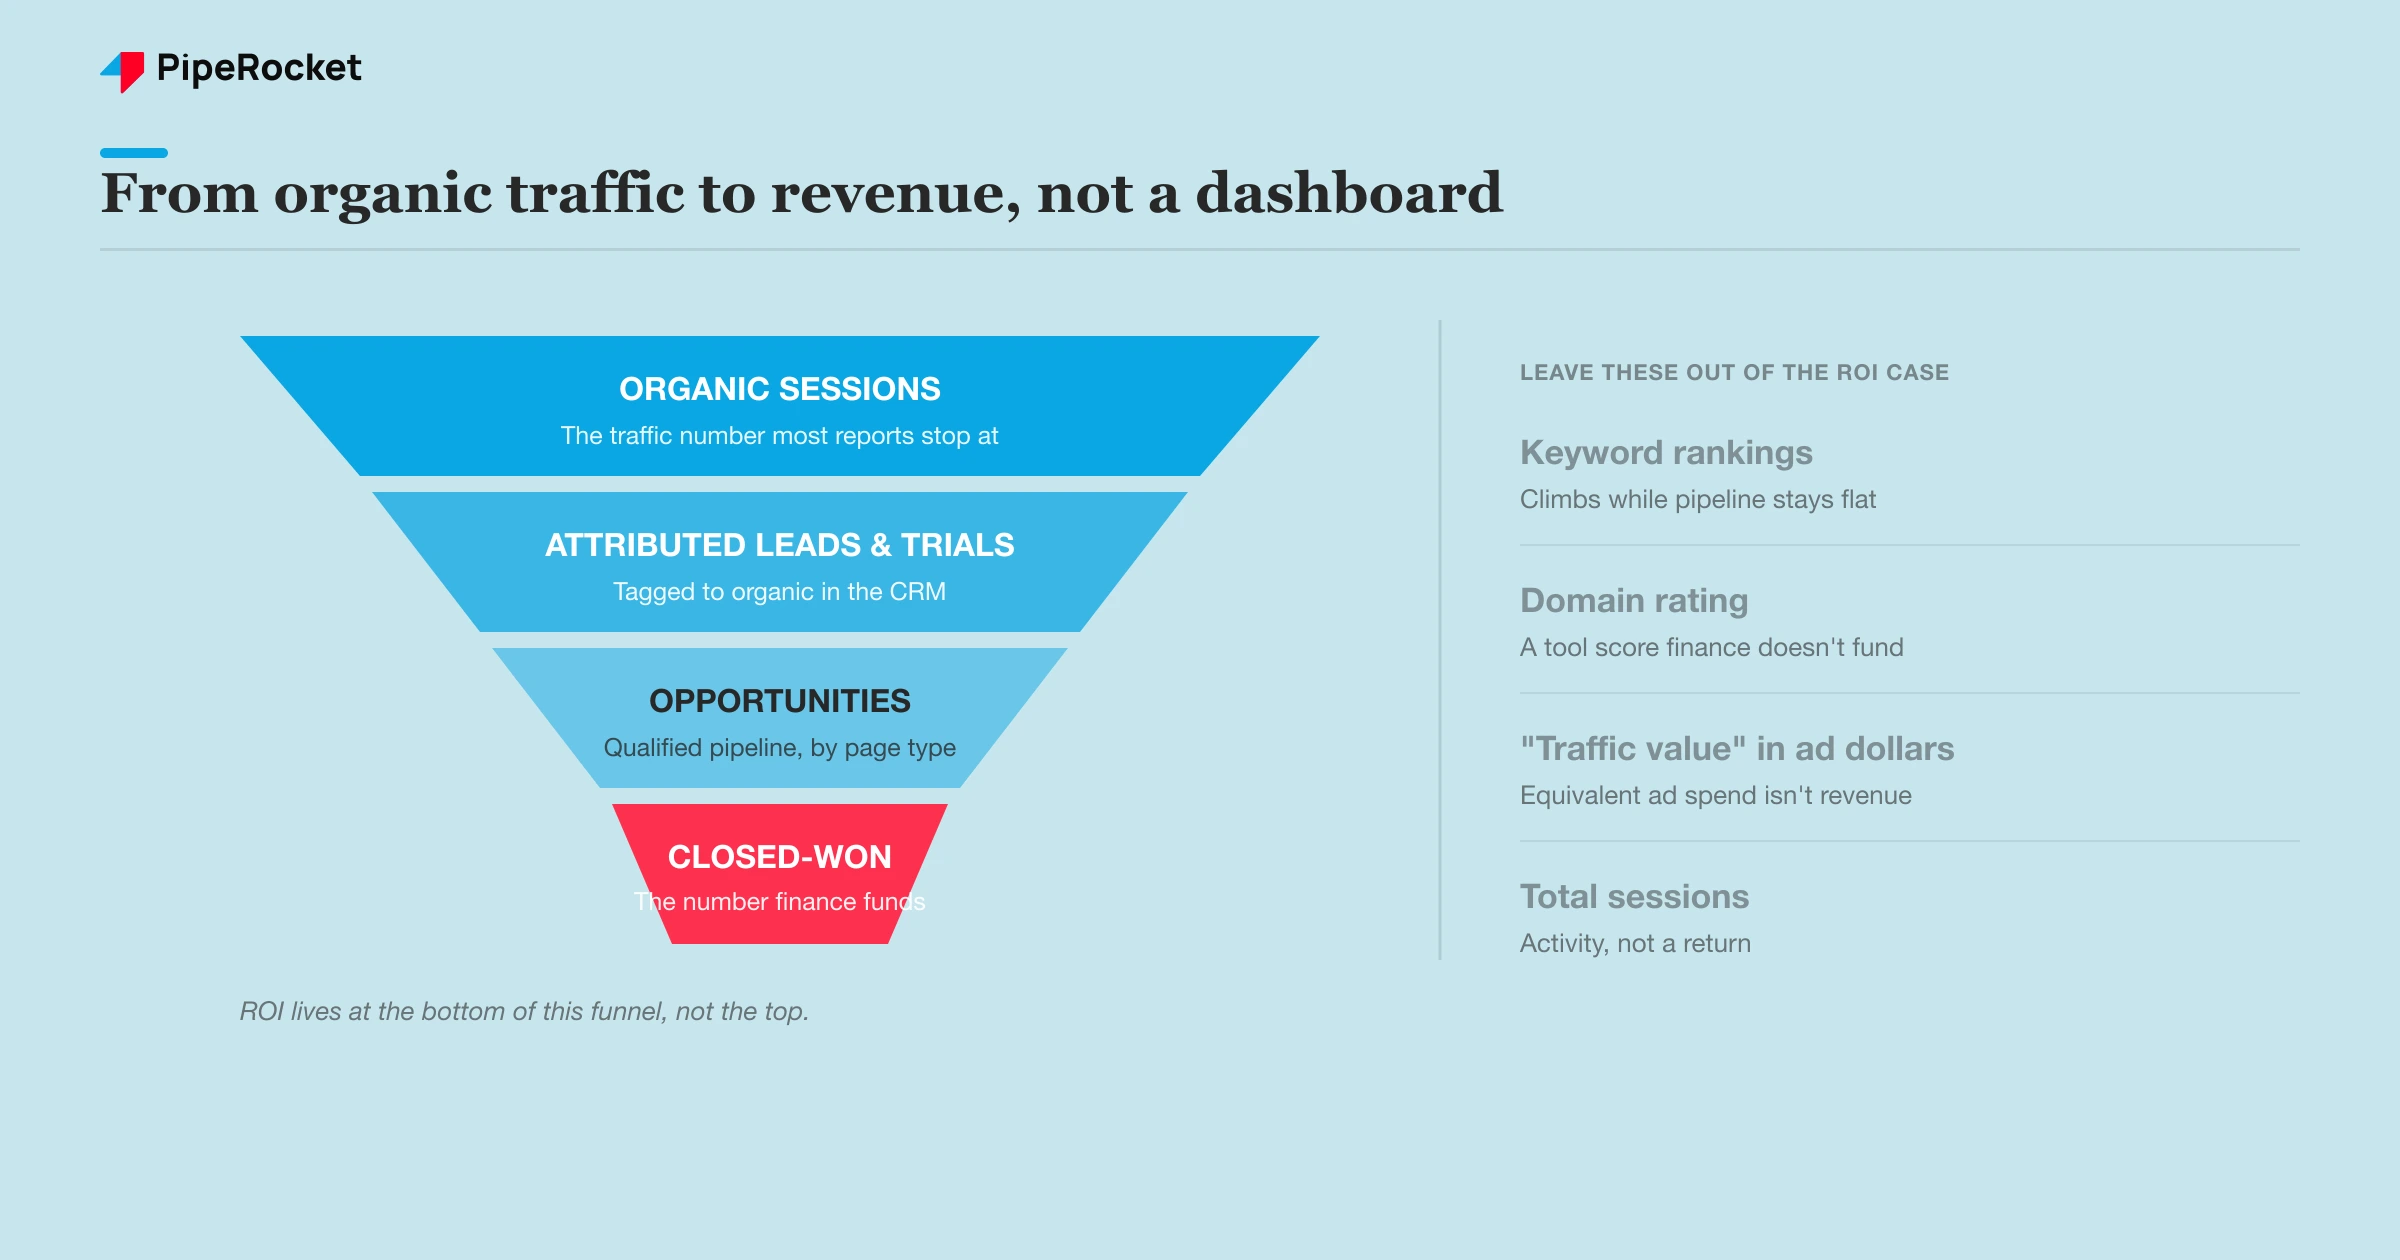
Step 2: Judge Each Page Type by Its Own Benchmark
Don’t measure every page against one blended conversion rate . A comparison page and a top-of-funnel blog post do completely different jobs, and holding them to the same number leads to bad decisions about what to cut and what to scale.
This is the part most ROI reports get wrong. They average everything into a single site-wide conversion rate, see “0.9%,” and either panic or relax without knowing which pages earned it. The average tells you nothing about which page type is actually pulling weight.
Our team reports conversion by page TYPE and holds each to its own bar:
| Page type | Intent | Realistic conversion | What “conversion” usually means |
|---|---|---|---|
| Alternative / comparison pages | High, near-purchase | ~3-4% | Demo or trial request |
| Product / feature pages | Mid to high | Varies, demo-led | Demo or sales contact |
| General top-of-funnel content | Low, learning | ~0.75% | Asset download, not a demo |
Read that table before you judge a single page. A blog post converting at 0.75% isn’t broken, it’s doing its job. A comparison page converting at 0.75% is broken, because it should be doing 3-4%.
Here’s why this matters for ROI specifically. If you judge a top-of-funnel post by the comparison-page benchmark, you’ll kill content that’s quietly feeding the funnel. If you judge a comparison page by the blog benchmark, you’ll leave a high-intent page underperforming and call it a win. Page-type benchmarks are how you make honest cut-or-scale calls.
Tie Each Page Type Back to Pipeline Differently
A top-of-funnel post and a bottom-of-funnel page contribute to pipeline in different shapes, so credit them differently. The comparison page often gets last-touch credit because it’s where the demo request happens. The blog post rarely gets last-touch credit, but it frequently shows up as the first touch in a closed deal weeks earlier.
If your report only counts last-touch, your top-of-funnel content will look worthless and your BOFU pages will look like heroes. Both readings are wrong. Pull first-touch and multi-touch views so the early-funnel content gets the assist credit it earned, otherwise you’ll defund the top of your own funnel and wonder why BOFU pages run dry six months later.
Step 3: Account for the Dark Funnel Before You Report a Number
Some of organic’s real impact will never show up as “organic” in your analytics, so a strict last-click number undercounts SEO . If you report only what the tool attributes cleanly, you’ll understate the channel and hand finance an easy reason to cut it.
The pattern shows up clearest in branded and direct traffic. Across the work we’ve done, homepage conversions have climbed steadily month over month in accounts where content and AI-driven discovery were feeding branded search.
Someone reads your content or finds you through an AI assistant, doesn’t convert, then comes back days later by typing your brand name straight into Google. Standard attribution credits that conversion to “branded” or “direct,” never to the content that started it.
That’s the dark funnel: real influence that the measurement model can’t see. The right response is to report two layers rather than to invent numbers:
- Directly attributed organic pipeline: the conservative, defensible number you’d take into a finance review.
- Influenced pipeline: branded and direct growth that tracks with your content investment, presented as directional rather than exact.
Keep them separate and label them honestly. The directly-attributed number is your floor. The influenced number is context that explains why branded search is rising while you invest in organic. A CFO will trust a person who says “here’s what I can prove, and here’s what I believe is also happening” far more than one who claims a single suspiciously clean figure.
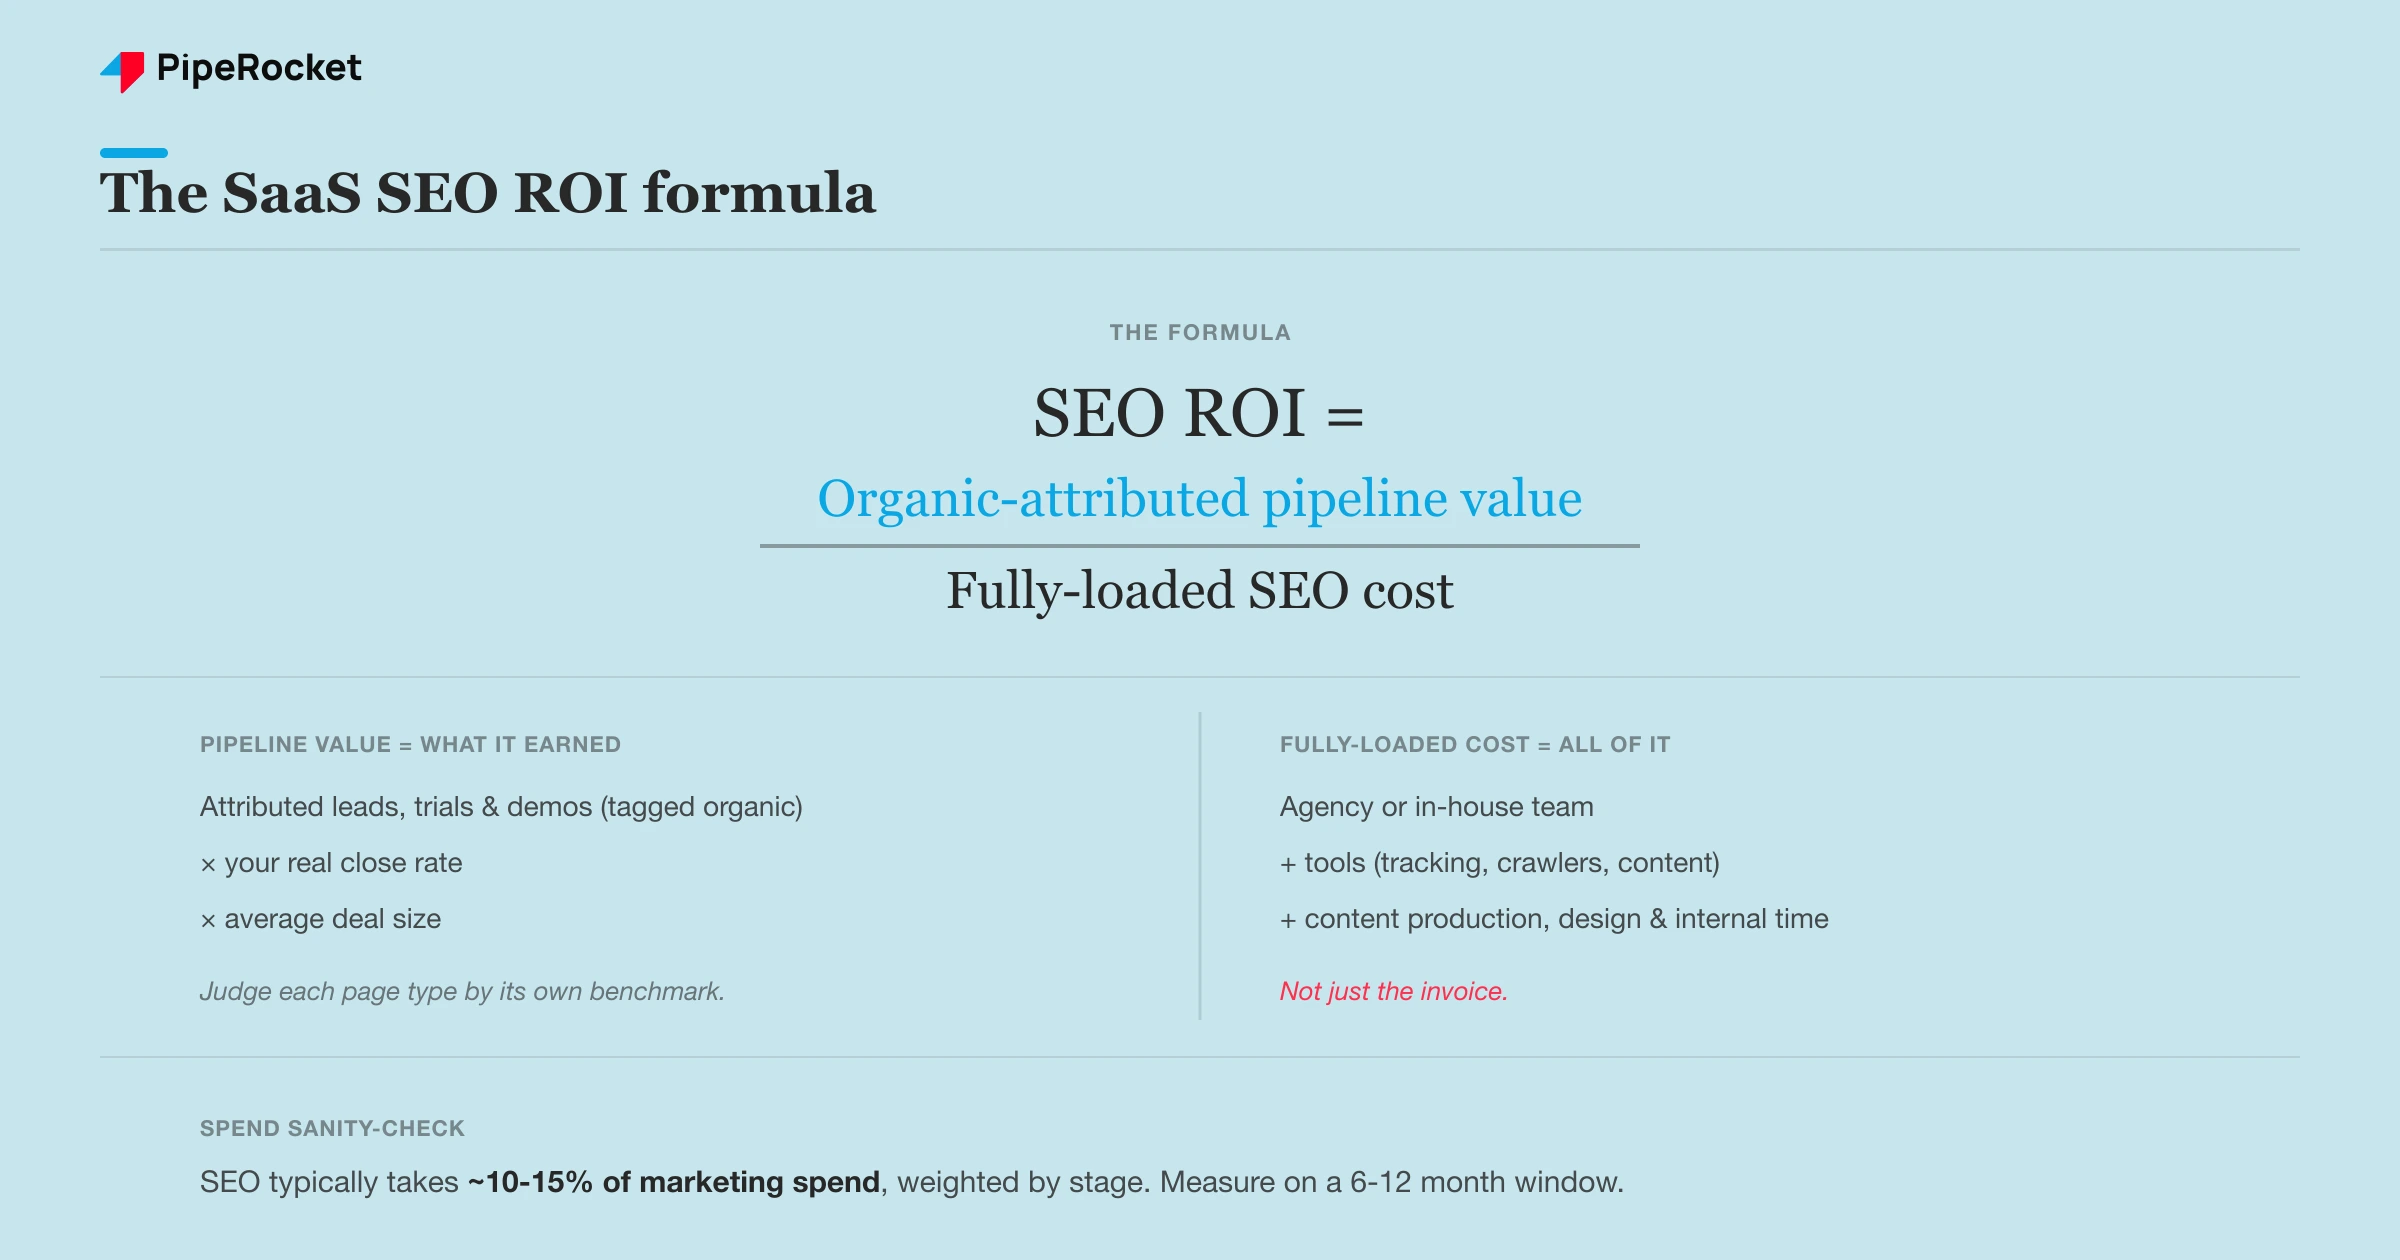
Step 4: Build the ROI Math Against a Cost Benchmark
Now do the actual math: organic-attributed pipeline value divided by the fully-loaded cost of producing it. ROI is a ratio, and the denominator is where most reports cheat.
The fully-loaded cost has to include everything, not just the agency invoice:
- Agency or in-house team cost
- Tools (rank tracking , crawlers, content tools)
- Content production and design
- Internal time spent on SEO
Be honest about the tooling line in particular, because it adds up fast across rank tracking, crawling , and the SEO reporting tools that assemble the quarterly deck. Take a worked example. A compliance SaaS for fintech teams attributes a quarter’s organic-sourced pipeline, applies its real close rate and average deal size to get revenue, then divides by its all-in SEO cost for the same quarter. That ratio is the ROI number. No rankings in sight.
To sanity-check whether the spend itself is reasonable, weigh it against a planning benchmark. As a working range, SaaS companies tend to put roughly 10-15% of their marketing budget into SEO, weighted by stage. Earlier-stage companies often run higher to establish presence; scaling companies lean in further as organic becomes a primary pipeline channel. Treat it as a stage-dependent range, not a fixed rule.
Note: Use a payback window, not a single month. SEO compounds and lags, so a one-month ROI snapshot will look terrible early and unrealistically great later. Judge it on a trailing 6-to-12-month basis so the lag and the compounding both show up honestly.
That benchmark does two jobs in your report. It tells leadership whether you’re under-investing in a channel that’s working, and it frames the ROI number against what peers spend, which is the comparison a finance team reaches for anyway. Once the proven number holds up, the same attribution and close-rate inputs let you forecast pipeline from SEO for the next few quarters instead of only reporting the last one.
Step 5: Report It on a Cadence Leadership Actually Trusts
Report ROI quarterly with a method that never changes, not monthly with a number that swings. Trust in an SEO number comes from consistency of method far more than from the size of the figure.
A monthly traffic chart trains leadership to watch the wrong thing and react to noise. A quarterly pipeline-attributed report, built the same way every time, trains them to treat SEO like the revenue channel it is, which is also what makes it credible when you report it to the board rather than just the marketing team. The cadence itself is a signal: short windows say “marketing activity,” quarterly windows say “investment with a return.”
Lock the method so the number is comparable quarter to quarter, and settle on the KPIs a CFO trusts before the first report so you aren’t redefining them later:
- Same attribution rules every report
- Same page-type benchmarks
- Same definition of “qualified”
- Same cost inputs
The moment you change how you count, you lose the ability to show a trend, and the trend is the whole point. Build the report once, then defend the method, not just this quarter’s figure. When a number moves, you want the conversation to be about why pipeline changed, not about whether you measured it differently this time.
How to Calculate SEO Payback Period for SaaS
The payback window from Step 4 has a specific number behind it: the payback period, or how long organic revenue takes to recover what you spent to earn it. For SaaS, recurring revenue and churn change the math, so it’s worth calculating properly instead of eyeballing.
The core formula is simple:
Payback Period = Total SEO Investment / Monthly Revenue from Organic
Work it out step by step
Start with your fully-loaded monthly SEO investment: agency or team cost, tools, content production, and any tech or dev work. Say that comes to $5,000 a month.
Then calculate monthly organic-attributed revenue, which is the hard part for SaaS:
Monthly Organic MRR = Organic Signups x Trial-to-Paid Rate x ARPU
As a worked example, 500 organic visitors convert to 50 trials at 10%, 5 of those go paid at a 10% trial-to-paid rate, and at a $200 ARPU that’s $1,000 a month in new organic MRR.
Now divide. If you’ve spent $15,000 over three months and organic generates $1,000 a month, payback lands at $15,000 divided by $1,000, or 15 months.
Use Lifetime Value Instead of First-Month Revenue
Because SaaS customers stick around, first-month MRR understates what each organic customer is actually worth. Swap in lifetime value for a truer picture:
Payback Period = Total Investment / (Monthly Organic Customers x LTV)
If those 5 monthly customers each carry an LTV of $1,200, one month of organic acquisition is worth $6,000 in lifetime value, and the payback picture improves sharply against the same $15,000 spend.
Why payback is hard to track for SaaS
Three things make this messier than a paid-channel payback calculation:
- SEO lag: organic revenue often starts 3 to 9 months after you begin investing, so the early months look terrible on paper.
- Attribution: organic-assisted conversions are hard to isolate in GA4 or HubSpot without the UTM tagging and CRM tracking that Step 1 sets up.
- Compounding: unlike paid, SEO compounds, so payback looks worse early and dramatically better later.
Read the number against a benchmark
Once you have a payback period, this is roughly how to read it for SaaS:
| SEO payback period | Interpretation |
|---|---|
| Under 6 months | Exceptional, usually low investment or high ARPU |
| 6 to 12 months | Strong |
| 12 to 18 months | Acceptable for SaaS |
| 18 to 24 months | Borderline, review the content strategy |
| 24+ months | Needs justification, such as a very high LTV |
The real argument to make with leadership is residual value. Once content ranks, it keeps producing revenue with little ongoing spend, so frame it beyond the payback month itself. The honest version is “we hit payback at month 14, and the content keeps generating revenue for years at minimal maintenance cost.”
Common Mistakes That Make SEO ROI Look Fake
The fastest way to lose a finance team’s trust is a number that’s technically true but obviously gamed. Four patterns do it every time, and each one has a tell a CFO spots in seconds.
Reporting Traffic Value as ROI
SEO tools will tell you your organic traffic is “worth $80,000 in equivalent ad spend.” Finance learned to ignore that line years ago: it’s a hypothetical, not money in the bank, and it assumes you’d have bought the traffic at full CPC , which no one would. Keep it out of the ROI case, or at most park it in the appendix as a directional brand metric.
Counting Assisted Conversions as Direct
Multi-touch credit is genuinely useful context, but folding influenced pipeline into your headline ROI figure is where reports come apart. The moment a board member asks “is that pipeline organic-sourced or just organic-touched?” and the honest answer is “both, blended together,” the whole number loses its footing.
Keep the two numbers in separate columns:
- Directly-attributed pipeline you can defend line by line. This is the headline.
- Influenced pipeline, flagged as directional. It supports the headline, it never replaces it.
Ignoring the Cost Side
Plenty of “10x ROI” claims divide pipeline by the agency retainer alone and quietly drop everything else the channel consumes:
- SEO tooling
- content production and freelance writers
- the internal hours your team spends managing the work
Leave those out and the ratio falls apart the first time finance cross-checks it against actual spend. A defensible 4x on fully-loaded cost beats a fantasy 10x that evaporates under one follow-up question.
Switching the Method to Flatter the Quarter
Changing attribution rules, benchmarks, or the definition of “qualified” between reports is the fastest way to manufacture a great-looking number and zero credibility. Finance notices when the methodology moves in lockstep with the results, and once they suspect the method is being tuned to the answer, every future number gets discounted.
The discipline that prevents it is dull but decisive: pick the method once, write it down, and hold it even on a bad quarter, because a number that occasionally dips beats a polished one nobody trusts.
How PipeRocket Helps You Prove SEO ROI
We don’t report rankings and call it a day. As a SaaS SEO agency , we tie organic to pipeline: tagged attribution, conversion benchmarked by page type, and a fully-loaded ROI number built on a method that holds up quarter to quarter.
We separate what we can prove from what we believe is influencing branded search, so the figure survives a finance review instead of collapsing under one question. If you want SEO reported as a revenue channel, reach out to us and we’ll build it with you.
Frequently Asked Questions
How do you calculate SEO ROI for a SaaS company?
Divide the value of organic-attributed pipeline by the fully-loaded cost of your SEO program for the same period. The pipeline value comes from tagging organic-sourced leads, trials, and demos in your CRM, then applying your real close rate and average deal size to get revenue. The cost has to include the team or agency, tools, content production, and internal time, not just the invoice. Use a trailing 6-to-12-month window rather than a single month, because SEO lags and compounds.
Is traffic a good measure of SEO ROI?
No. Traffic is an activity metric, not a return metric, and it can rise while pipeline stays flat or even falls. A traffic spike driven by low-intent top-of-funnel terms can make a program look healthy while it’s actually starving the pipeline. Traffic is worth tracking as a leading indicator, but it should never be the headline of an ROI report. The number that proves ROI is organic-attributed pipeline and the revenue that follows it.
Why does SEO ROI take so long to show up?
Because organic search compounds and lags. New content takes time to get indexed, earn authority, and climb to positions that drive meaningful traffic, and the buyers it reaches often take months to convert in a B2B SaaS cycle. A one-month ROI snapshot will almost always look bad early, which is why a trailing 6-to-12-month payback window is the honest way to measure it. Judge the channel on the timeline it actually operates on, not on a single reporting period.