
What Is Page Speed? Why the PageSpeed Insights Score Isn't the Whole Story
 Kamaraj Mathiarasan (Kim)
Last updated on
Kamaraj Mathiarasan (Kim)
Last updated on
Page speed is how quickly a webpage loads and becomes usable for a visitor, tracked across several distinct moments rather than one number. It’s not a single score. Google and real visitors judge it through metrics like load time and responsiveness working together.
TL;DR
- Page speed covers several separate metrics, including how fast content loads and how fast the page responds to a click or tap.
- Lab tools like PageSpeed Insights simulate one fixed condition, while field data from CrUX captures what real visitors experienced on their own devices.
- Core Web Vitals (LCP, INP, CLS) plus TTFB make up most of what people mean when they say “page speed.”
- Teams that optimize purely for a lab score can ship a page that tests fast in Lighthouse but still feels slow to real visitors.
- Slow page speed quietly bleeds trial signups and demo requests before a visitor ever reads your pitch.
What Is Page Speed?
Page speed is how fast a webpage loads and reacts, measured from several angles: when content first paints, when the page becomes usable, and when it stops shifting under the cursor. Most explanations flatten all of that into one number, the PageSpeed Insights score.
That number is a lab measurement of a single simulated visit. It’s not what real people, on real phones and networks, actually experienced. Page speed is one piece of technical SEO , and it’s the piece most teams measure wrong.
- Loading speed: How quickly the main content becomes visible, tracked by Largest Contentful Paint (LCP).
- Responsiveness: How fast the page reacts to a click, tap, or keypress, tracked by Interaction to Next Paint (INP).
- Visual stability: Whether elements jump around while the page loads, tracked by Cumulative Layout Shift .
- Server response: How long the server takes to send back the first byte, tracked by Time to First Byte (TTFB).
- Perceived speed: How fast the page feels to the person using it, which doesn’t always match what a lab test reports.
Most teams chase a perfect PageSpeed Insights score. That’s a mistake, because a 100 score tells you your page can load fast under ideal conditions. It doesn’t tell you it did load fast for the visitor who just bounced off your pricing page.
Consider a billing tool for procurement teams that spent a quarter pushing its Lighthouse score from 74 to 98. The homepage tested faster on every audit. Real visitors on mid-range Android phones still called the pricing page sluggish, since the lab test ran on a connection they didn’t have.
Page speed is a bundle of separate measurements, and each one can move on its own. Fixing one doesn’t fix the rest, and a great score on one metric can hide a real problem sitting right underneath it.
What’s the Difference Between Lab Data and Field Data?
Lab data is a single simulated test run in a controlled environment. Field data is the real performance recorded from actual visitors through the Chrome User Experience Report (CrUX). They frequently disagree, and field data is what actually determines whether a visitor had a good experience.
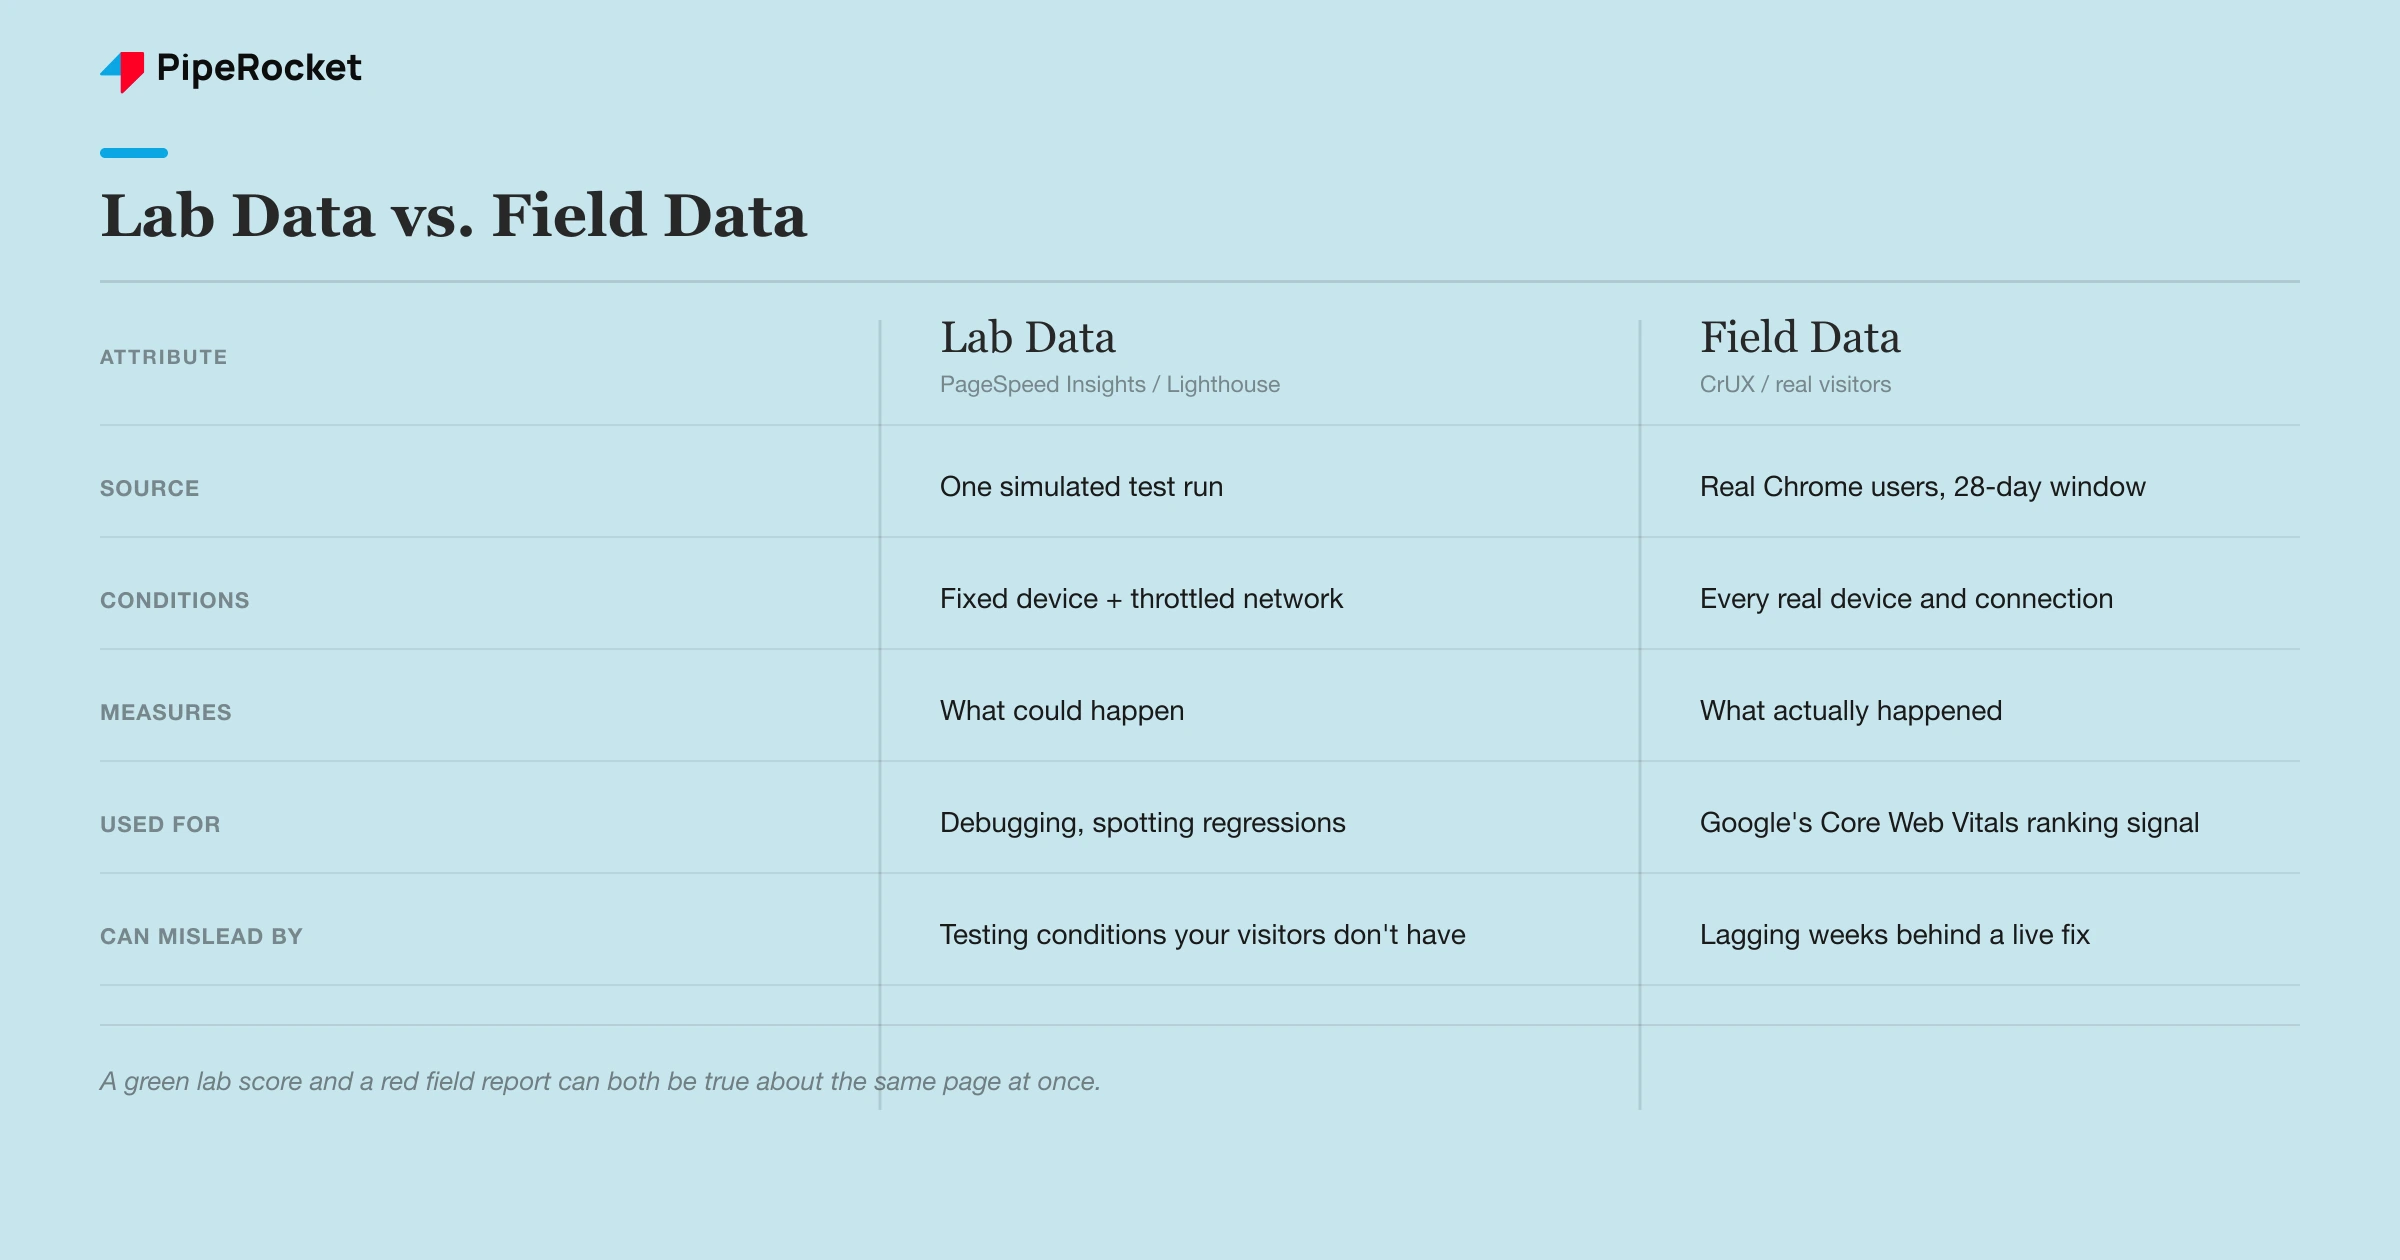
- Lab data: Runs Lighthouse or PageSpeed Insights on a fixed device profile and network throttle, on a single page load, every time.
- Field data: Aggregates real Core Web Vitals scores from actual Chrome users over roughly the past 28 days, across every device and connection they used.
- Where they diverge: A page with a fast server and no ads can test great in the lab, then still feel slow to visitors on older phones or spotty wifi.
- What Google actually ranks on: Search uses field data, not your Lighthouse score, when Core Web Vitals factor into rankings.
A compliance tool for healthcare vendors once passed every lab audit its dev team ran. Its CrUX report told a different story. The 75th percentile LCP for mobile visitors sat well above “good,” because most real signups came from hospital wifi, not the office broadband its QA team tested on.
Also read: best SaaS SEO agencies
What Metrics Actually Make Up Page Speed?
Four metrics make up most of what people mean by page speed: LCP, INP, CLS, and TTFB. Three of them, LCP, INP, and CLS, are Google’s Core Web Vitals. TTFB measures the server’s speed before any of that even starts.
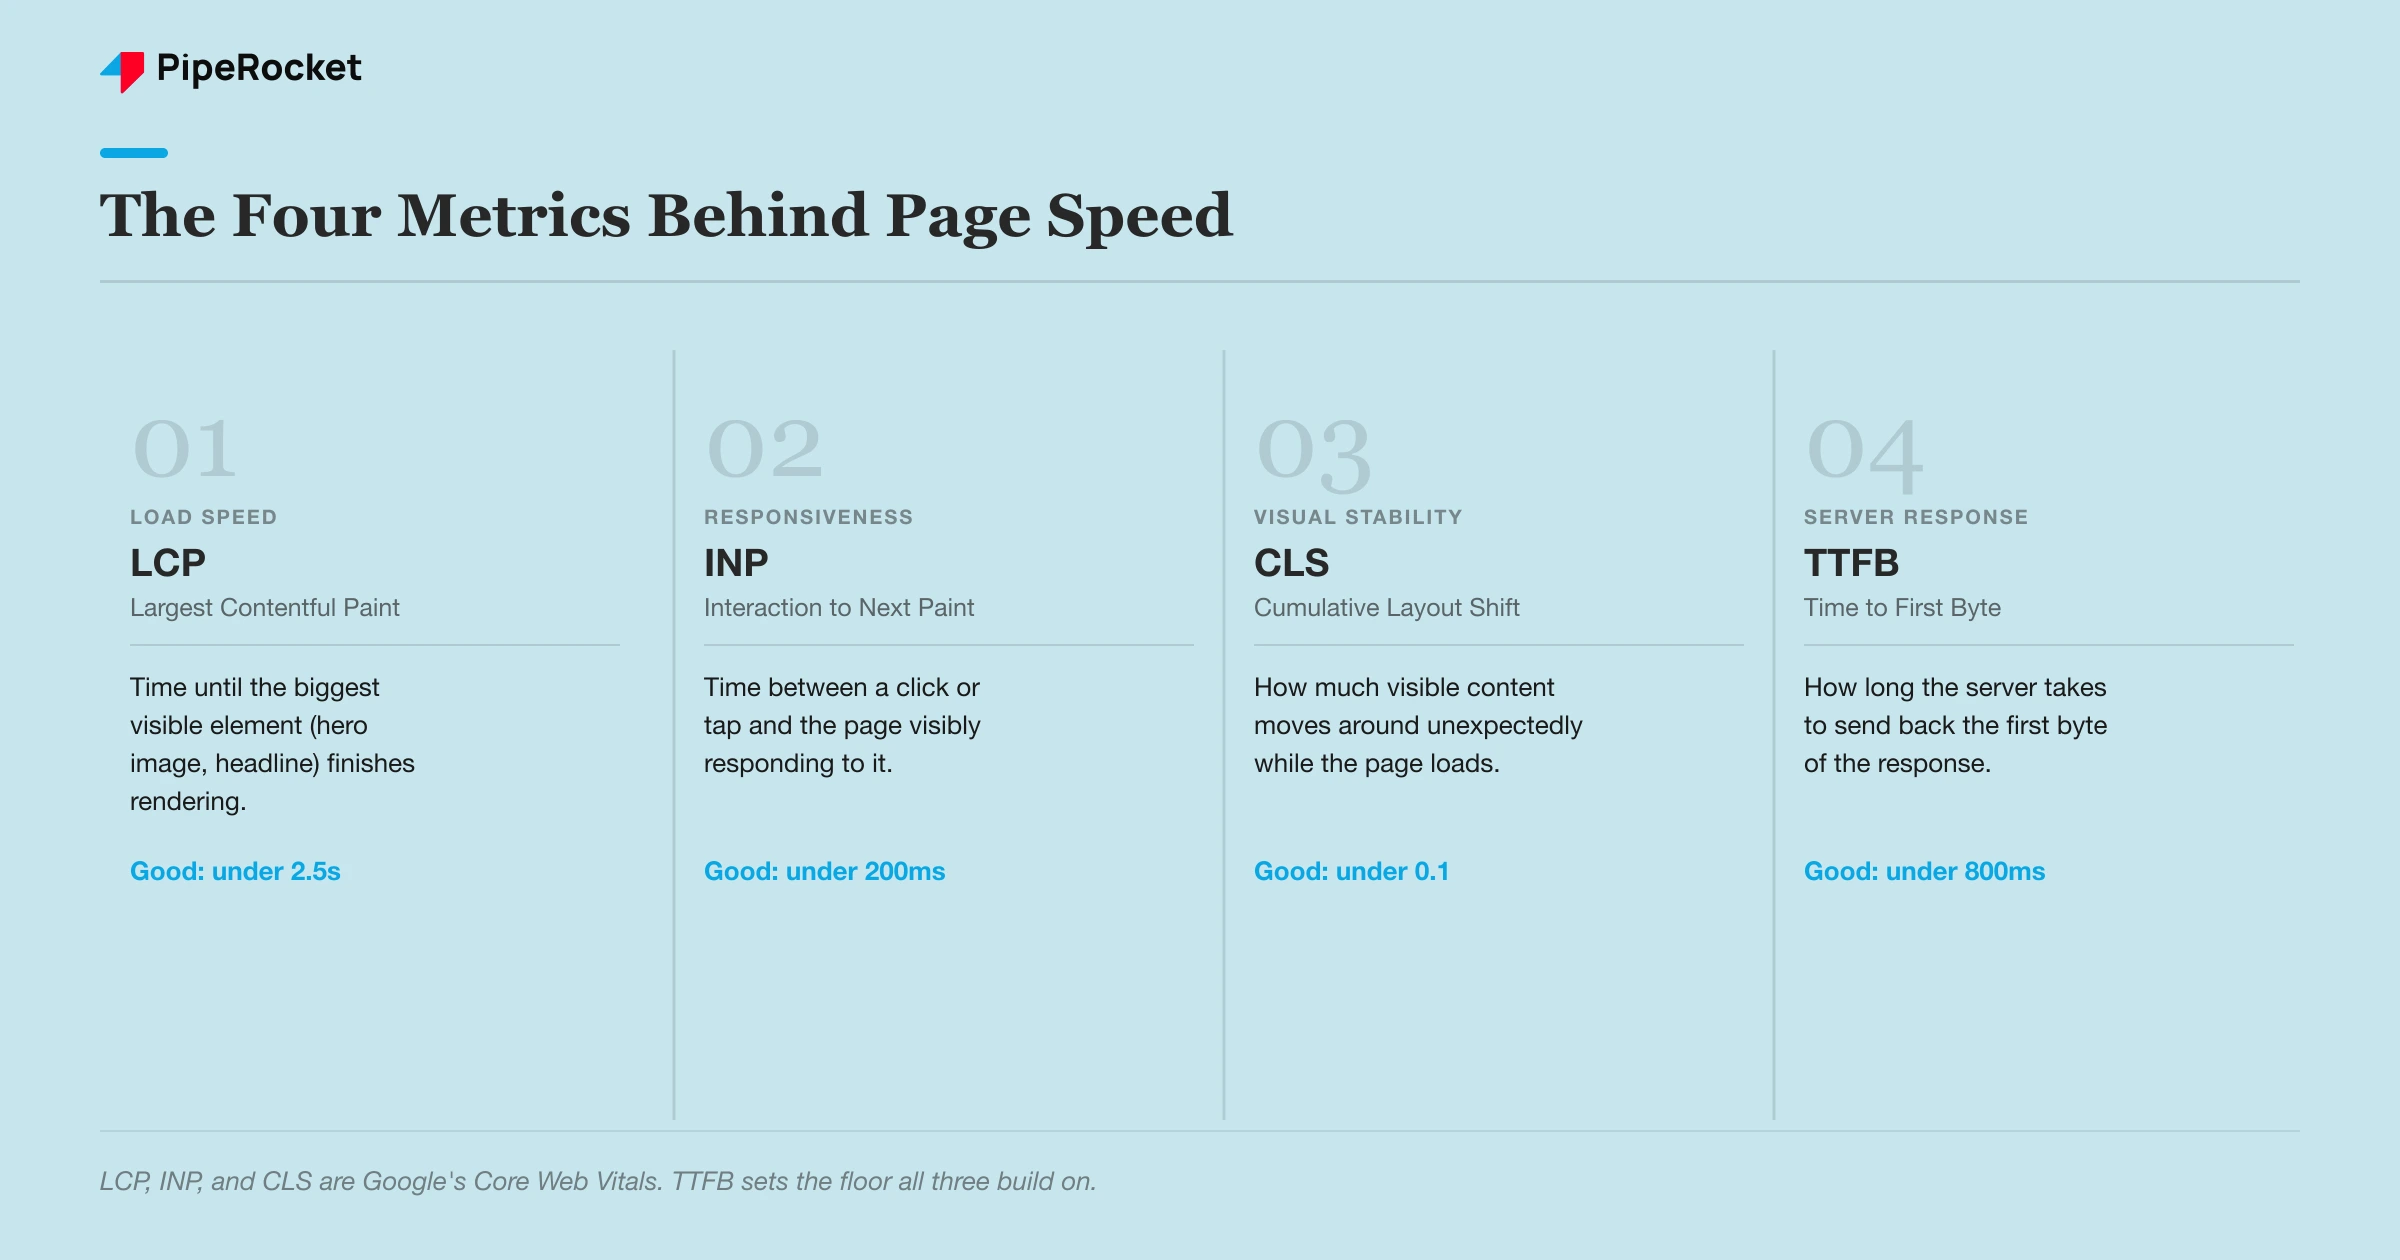
- LCP (Largest Contentful Paint): Time until the biggest visible element, usually a hero image or headline, finishes rendering. Under 2.5 seconds is good.
- INP (Interaction to Next Paint): Time between a visitor’s click or tap and the page visibly responding. Under 200 milliseconds is good.
- CLS (Cumulative Layout Shift): How much visible content moves around unexpectedly while the page loads. Under 0.1 is good.
- TTFB (Time to First Byte): How long the server takes to send the first byte of a response. Under 800 milliseconds is a reasonable target.
These four numbers rarely move together. A SaaS dashboard can nail TTFB with a fast CDN and still fail INP, because a heavy JavaScript bundle blocks the main thread the moment someone clicks “Upgrade.” That’s a page speed problem a fast server can’t fix on its own.
Also read: SaaS SEO agency
Why Do PageSpeed Insights Scores Sometimes Lie?
PageSpeed Insights scores lie when they measure a best-case scenario that doesn’t match how your actual visitors browse. The score itself is real, but the conditions behind it are synthetic, and synthetic conditions rarely match a visitor on a three-year-old phone using hotel wifi.
Most teams treat a 95-plus PSI score as proof the job is done. That’s backwards, because PSI never asks what your visitors’ devices or connections actually look like. It only reports what happens under one fixed, simulated condition, every single time.
- Fixed throttling: PSI simulates a mid-tier mobile connection and CPU, which may be faster or slower than your real traffic mix.
- Single run: One test run misses the variance real visitors hit from server load, caching state, and geography.
- No real interaction: Lab tools estimate responsiveness. They can’t measure what happens when a real person actually clicks something.
- Ignores your funnel: A high score on the homepage says nothing about your pricing page, signup form, or in-app onboarding screens.
Fast Fact: Organic search drives 91.3% of SaaS traffic, AI-referred visits account for less than 9%.
That traffic mostly lands on pages your team rarely runs through PSI on its own, like deep blog posts or comparison pages . If those pages are slow in the field, the homepage score won’t save them.
How Do You Actually Fix Page Speed Without Breaking the Experience?
You fix page speed by treating each metric as its own problem, not one blanket fix. LCP, INP, CLS, and TTFB each trace back to different code, so the fix that helps one rarely touches the others.
- Compress and size images: Serve modern formats like WebP and set explicit width and height so the browser doesn’t guess.
- Defer non-critical JavaScript: Load chat widgets, analytics, and marketing pixels after the main content renders.
- Use a CDN and caching: Cut TTFB by serving cached assets from servers physically closer to the visitor.
- Audit third-party scripts on a schedule: A single new pixel from a marketing tool can quietly undo months of INP work.
Lazy-loading every image below the fold helps LCP, but it can hurt CLS if the browser doesn’t know the image’s dimensions ahead of time. It’s worth the trade if you set explicit dimensions first, so nothing has to guess its own size mid-load.
This approach works well for marketing pages and blog content, where you control every asset on the page. For a SaaS product’s in-app dashboard, third-party widgets and live data feeds make INP much harder to fix, because you’re often optimizing code you don’t own.
Fast Fact: Organic search converts SaaS visitors at 0.92%, more than 3x the rate of AI-driven traffic at 0.26%.
A slow page bleeds exactly this kind of high-intent traffic. Treating speed fixes as a one-time sprint instead of a recurring audit costs more than most teams realize, especially once a new script sneaks back in.
Also read: best B2B SEO agencies
Frequently Asked Questions
1. How is page speed different from Core Web Vitals?
Page speed is the broad, everyday term for how fast and responsive a page feels. Core Web Vitals are Google’s specific, named set of three metrics (LCP, INP, CLS) that it uses to quantify part of that experience. TTFB, total load time, and other performance signals fall under page speed but aren’t officially Core Web Vitals themselves. Think of Core Web Vitals as Google’s chosen subset of the full page speed picture.
2. How often should I recheck page speed after making a fix?
Recheck field data (CrUX or Search Console’s Core Web Vitals report) roughly every 28 days, since that’s the rolling window Google uses to refresh those reports. Lab tools like PageSpeed Insights can be rerun immediately after a deploy to catch obvious regressions. Set a recurring quarterly audit at minimum, since new third-party scripts and marketing tags tend to creep back in quietly.
3. Does a fast page speed guarantee better rankings?
No. Page speed is one of many ranking factors, and Google has said content relevance and quality outweigh it in most cases. A fast page with weak content still loses to a slower page that better answers the query. Page speed mainly acts as a tiebreaker and a conversion lever: it rarely gets a weak page to rank, but a slow page can actively hold back an otherwise strong one.
The Bottom Line
Treat page speed as four metrics that drift on their own schedules, not one report-card number you fix once and file away. Real visitors will tell a different story than your lab score, if you let them. Check field data as often as the lab score, not instead of it.
If you want a technical SEO team that treats page speed as an ongoing discipline instead of a one-time audit, get in touch or see how we approach SaaS SEO .