
What Is Magic Number in SaaS? The Real Sales Efficiency Test
 Kamaraj Mathiarasan (Kim)
Last updated on
Kamaraj Mathiarasan (Kim)
Last updated on
The SaaS Magic Number measures how much new annual recurring revenue you generated this quarter for every dollar spent on sales and marketing last quarter. It’s a quick efficiency check, not a valuation metric, and it only means something once you know what it’s hiding.
TL;DR
- The Magic Number divides this quarter’s new ARR growth by last quarter’s sales and marketing spend, showing revenue return per dollar.
- A score above 0.75 usually signals healthy sales efficiency, and above 1.0 means you can probably spend more on growth.
- The metric assumes a roughly one-quarter lag between spend and bookings, which breaks down badly for longer enterprise sales cycles.
- Product-led and usage-based SaaS businesses often score low on this metric even when their growth engine is genuinely working.
- One weak quarter rarely means much on its own. The trend across three or four quarters is what actually tells you something.
What Is the SaaS Magic Number?
The SaaS Magic Number is a sales efficiency ratio that tells you how much new recurring revenue your sales and marketing spend produced, one quarter after you spent it. Bessemer Venture Partners popularized it, and most SaaS boards still ask about it every quarter.
Here’s the part most explainers skip: the number was built around a specific kind of company. A three-to-six-month sales cycle, mostly new-logo growth, and a sales team converting spend into bookings on a predictable lag. Plenty of SaaS businesses don’t look like that anymore.
- New ARR growth: The increase in annualized recurring revenue between two quarters, before you compare it to spend.
- Prior-quarter S&M spend: The denominator uses last quarter’s spend, not this quarter’s, because it assumes a lag between spending and closing.
- A ratio, not a dollar figure: A Magic Number of 1.0 means $1 of new ARR for every $1 spent the quarter before. It’s not profit and it’s not margin.
- A trailing indicator: It tells you what already happened. It won’t tell you if next quarter’s pipeline is healthy.
- Board-level, not team-level: It’s a company-wide efficiency signal. Using it to judge one rep or one channel misreads what it’s built for.
Consider a project management SaaS selling to mid-market operations teams on a four-month sales cycle. They spent $400,000 on sales and marketing last quarter and added $500,000 in new ARR this quarter. Their Magic Number is 1.25, comfortably in “keep spending” territory.
What this actually means in practice: the ratio only holds up if your sales cycle roughly matches the one-quarter lag baked into the formula. Stretch that cycle to nine or twelve months, and the number starts measuring something closer to noise.
Also read: how the best SaaS marketing agencies build efficient go-to-market motions
How Do You Calculate the SaaS Magic Number?
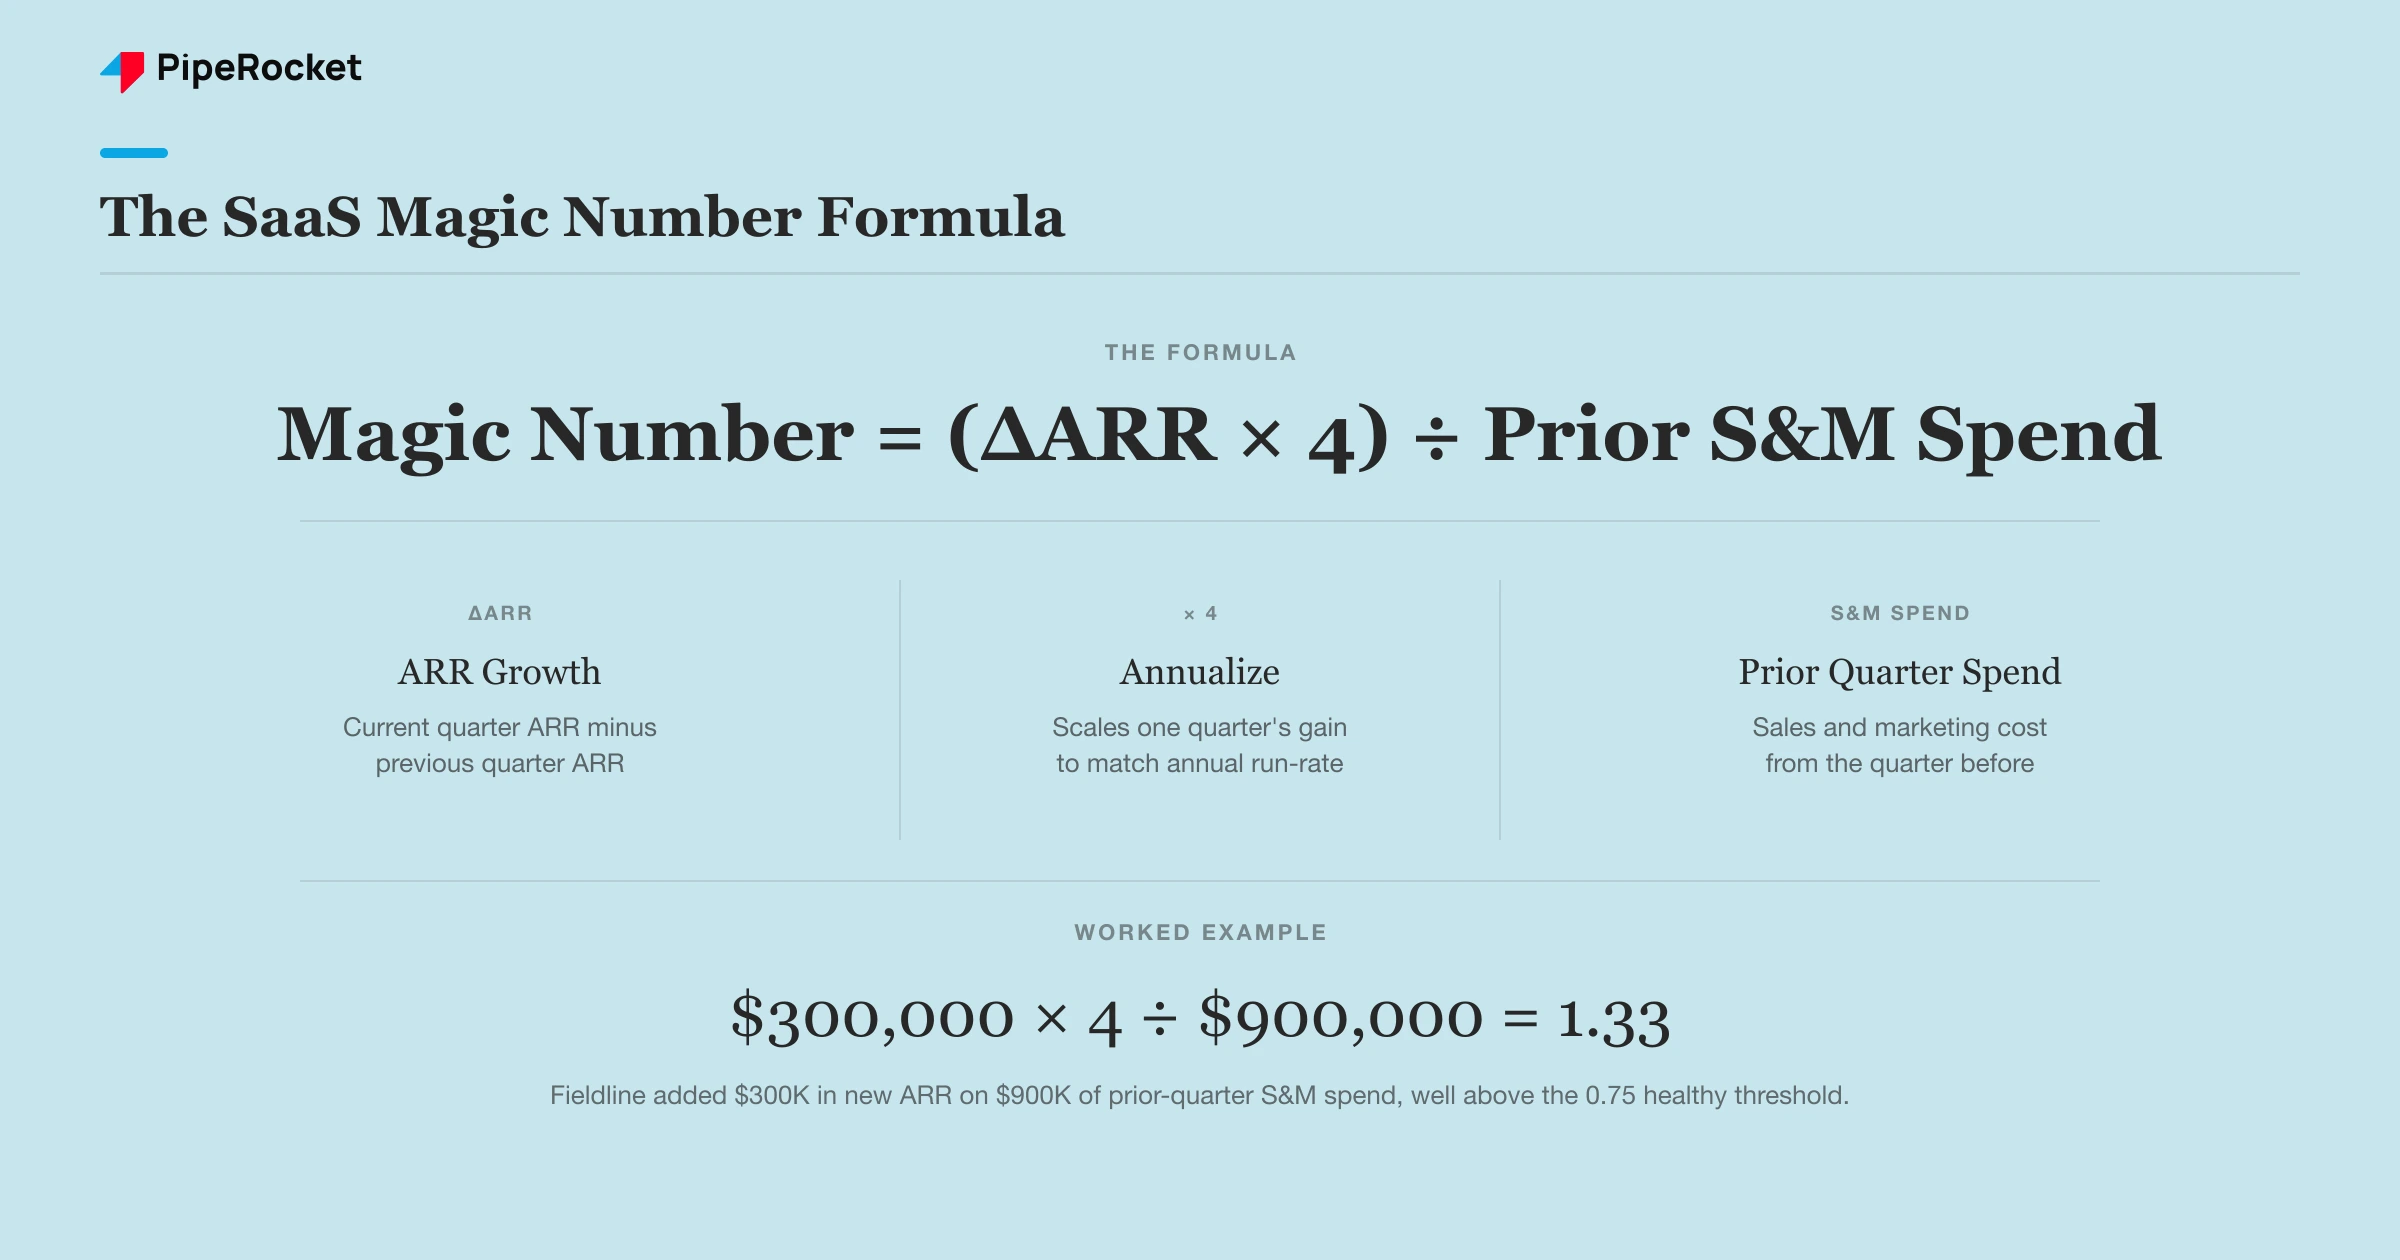
You calculate the Magic Number by taking the increase in annualized recurring revenue from the previous quarter to the current one, multiplying it by four, then dividing by the S&M spend from the quarter before that growth happened.
The formula, written out:
Magic Number = (Current Quarter ARR − Previous Quarter ARR) × 4 ÷ Previous Quarter S&M Spend
The ×4 step trips people up. You’re annualizing one quarter’s revenue gain so it’s comparable to the annual run-rate framing ARR already uses. Skip that step and every number you calculate reads artificially low.
Working the Numbers
Take Fieldline, a fictional SaaS for construction site inspections. Their ARR was $2.4 million last quarter and $2.7 million this quarter, a $300,000 gain. They spent $900,000 on sales and marketing the quarter before that gain landed.
Their Magic Number: $300,000 × 4 ÷ $900,000 = 1.33. That reads as strong efficiency, well above the 0.75 threshold most boards use as a baseline.
Fast Fact: Teams that calculate the Magic Number from bookings instead of recognized ARR growth tend to overstate it, since bookings can include multi-year deals that haven’t actually hit the books yet.
The most common calculation mistake isn’t the math. It’s the timing. Using this quarter’s S&M spend instead of last quarter’s spend produces a completely different, and usually misleading, number.
Also read: SaaS PPC services built around measurable pipeline, not just spend
What’s a Good Magic Number for a SaaS Company?
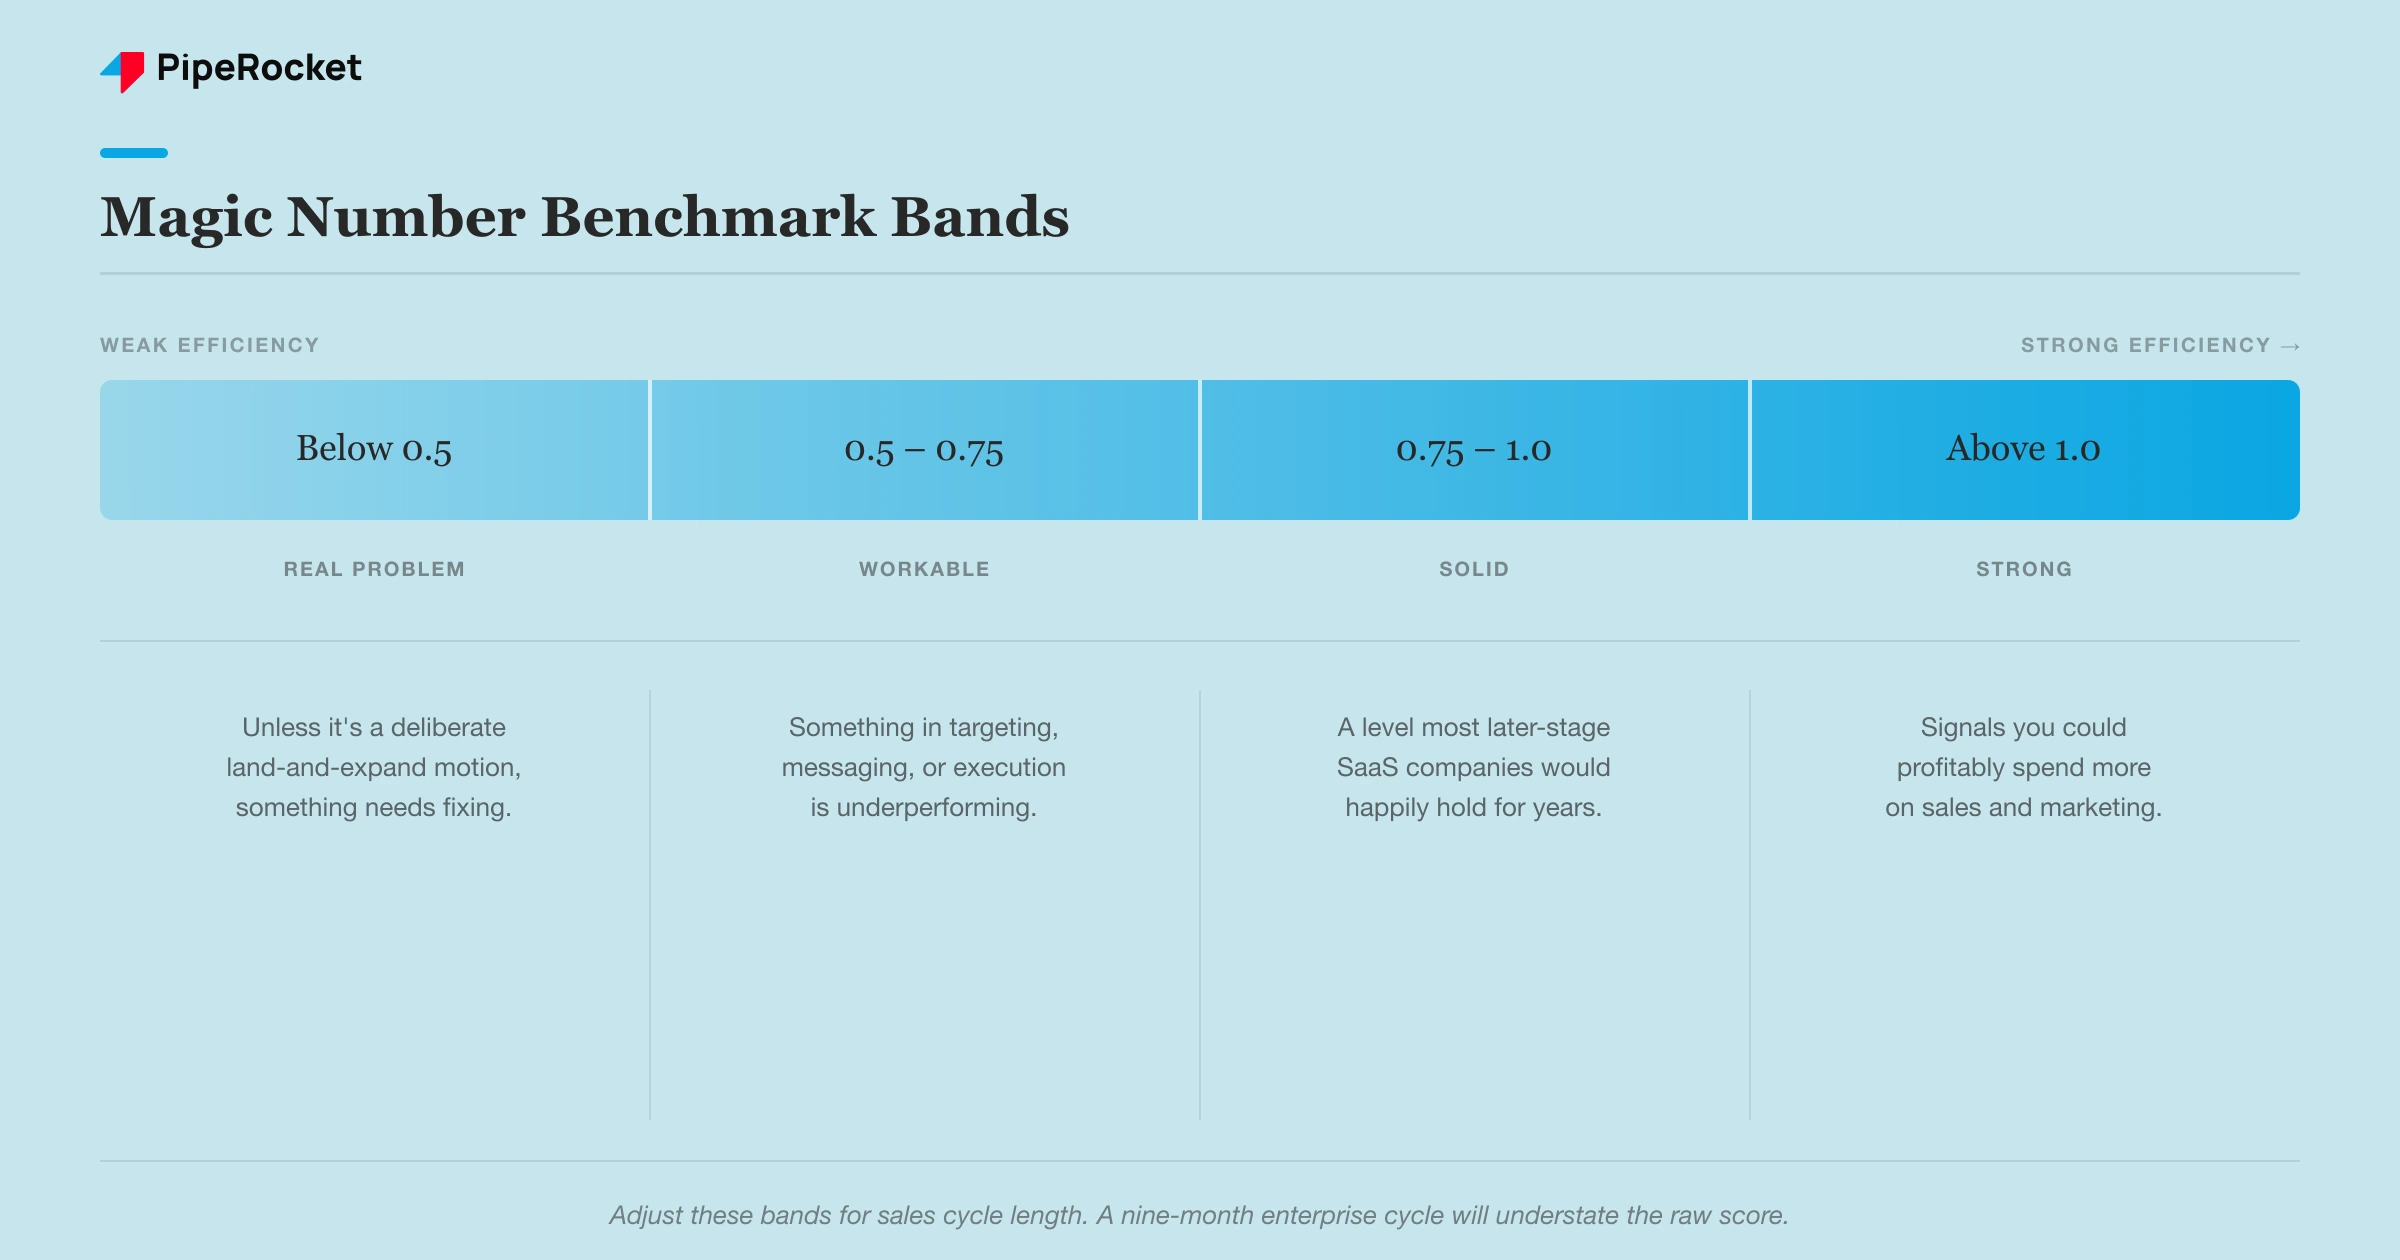
A Magic Number above 0.75 is generally considered healthy, and anything above 1.0 usually signals you could profitably spend more on sales and marketing without hurting efficiency. Below 0.5 typically means something in your go-to-market motion needs attention.
Most explainers stop at those three bands and call it done. That’s where the advice gets dangerous, because the “right” score depends heavily on your sales cycle length and your growth stage, not just the raw number.
- Above 1.0: Strong efficiency. Most fast-growing SaaS companies in expansion mode land here and use it as a signal to add sales headcount.
- 0.75 to 1.0: Solid, sustainable growth. Not spectacular, but a level most later-stage SaaS companies would happily hold for years.
- 0.5 to 0.75: Workable, but worth investigating. Something in targeting, messaging, or sales execution is probably underperforming.
- Below 0.5: A real efficiency problem, unless you’re in a deliberate land-and-expand motion where new-logo ARR is intentionally slow.
- Early-stage exception: Pre-Series-A companies often score below 0.5 simply because they’re still building repeatable sales motion, and that’s expected, not alarming.
Here’s the trade-off most benchmark tables don’t mention. A company running nine-month enterprise sales cycles will almost always score lower than the formula’s baseline assumes, because the ARR from this quarter’s spend hasn’t closed yet.
It’s worth adjusting your read of the number by roughly your actual cycle length divided by three months, rather than taking the raw score at face value.
Why Does the Magic Number Break Down for PLG and Usage-Based Pricing?
The Magic Number breaks down for product-led and usage-based SaaS because the formula assumes S&M spend directly drives ARR growth on a fixed lag, and that link is much weaker when self-serve signups, free trials, and usage expansion drive most of the revenue.
Most SaaS metric guides mention this in a single throwaway line, if at all. That’s the actual gap worth naming here.
A usage-based data infrastructure company might see most of its ARR growth come from existing customers scaling their consumption, not from new S&M-driven logos. The formula still divides by S&M spend, so the ratio looks artificially weak even when the business is compounding well.
- Attribution gets blurry: A free-trial user who converts eight months after signup can’t be cleanly tied to last quarter’s S&M spend.
- Expansion revenue muddies the numerator: ARR growth from existing accounts expanding usage gets lumped in with new-logo growth, even though it wasn’t bought with this quarter’s ad spend.
- Product-market fit can mask itself: A PLG company with genuinely strong retention can post a mediocre Magic Number simply because growth comes from the product, not the sales motion.
- The fix isn’t ignoring the metric: It’s pairing it with a parallel view, like CAC payback period or net-new-logo efficiency calculated separately from expansion.
A usage-based observability platform for infrastructure teams might show a Magic Number under 0.4 while growing ARR 60% year over year, almost entirely through account expansion. Reading that as a sales efficiency failure would be a mistake. The sales motion isn’t what’s driving the growth in the first place.
How Do You Improve a Low Magic Number?
You improve a low Magic Number by fixing whichever half of the ratio is underperforming: either new ARR isn’t growing fast enough relative to spend, or S&M spend is going toward channels and reps that aren’t converting efficiently.
- Audit spend by channel: Break S&M spend down by source and compare the ARR each channel actually produced, not just the leads it generated.
- Check sales cycle drift: If your cycle has quietly stretched from four months to seven, your Magic Number will look worse without anything else actually breaking.
- Look at win rate before headcount: Adding reps to a broken pipeline just spends more money at the same conversion rate. Fix the funnel first.
- Separate new-logo and expansion motion: If expansion is strong and new-logo is weak, that’s a targeting or messaging problem, not a general “sales is inefficient” problem.
- Give it two full quarters before reacting: One slow quarter is often a timing artifact from a deal that slipped, not a trend.
Fast Fact: Companies that track Magic Number alongside CAC payback period catch efficiency problems roughly a quarter earlier than teams watching either metric alone, since the two flag different failure modes.
A fintech compliance SaaS noticing a dropping Magic Number for two straight quarters would want to check whether their average deal size shrank, their sales cycle stretched, or a specific channel simply stopped converting, before assuming the whole go-to-market motion needs a rebuild.
Frequently Asked Questions
1. How does the Magic Number change if my sales cycle is longer than one quarter?
The formula assumes roughly a one-quarter lag between spend and bookings, so a nine-month enterprise cycle will consistently understate your real efficiency. A practical adjustment is calculating the ratio using S&M spend from two or three quarters back instead of one, then comparing that adjusted number against your own historical trend rather than the generic 0.75 benchmark.
2. Should I calculate the Magic Number using gross or net new ARR?
Most teams should use net new ARR, meaning gross new ARR minus churn and downgrades, because gross-only calculations can make a leaky business look efficient. If you’re specifically trying to isolate new-logo sales efficiency from retention performance, calculate both versions side by side rather than picking just one.
3. Is a Magic Number of 1.5 always better than 0.9?
Not automatically. A 1.5 driven by a single unusually large enterprise deal that closed early isn’t repeatable, while a steady 0.9 across four consecutive quarters shows a predictable motion you can plan around. Check whether the higher number came from broad-based growth or one outsized deal before treating it as the stronger signal.
The Bottom Line
The Magic Number is a useful gut-check, not a verdict. Read it against your actual sales cycle and growth motion, not the generic benchmark table, and track the trend over several quarters before deciding anything’s broken.
If you want a team that builds go-to-market content and demand programs around real sales efficiency instead of vanity traffic, get in touch or see how we approach SaaS SEO for growth-stage teams.